
Extended Data Fig. 5. Neurotransmitter identity and neuronal morphology in the anterior hindbrain.
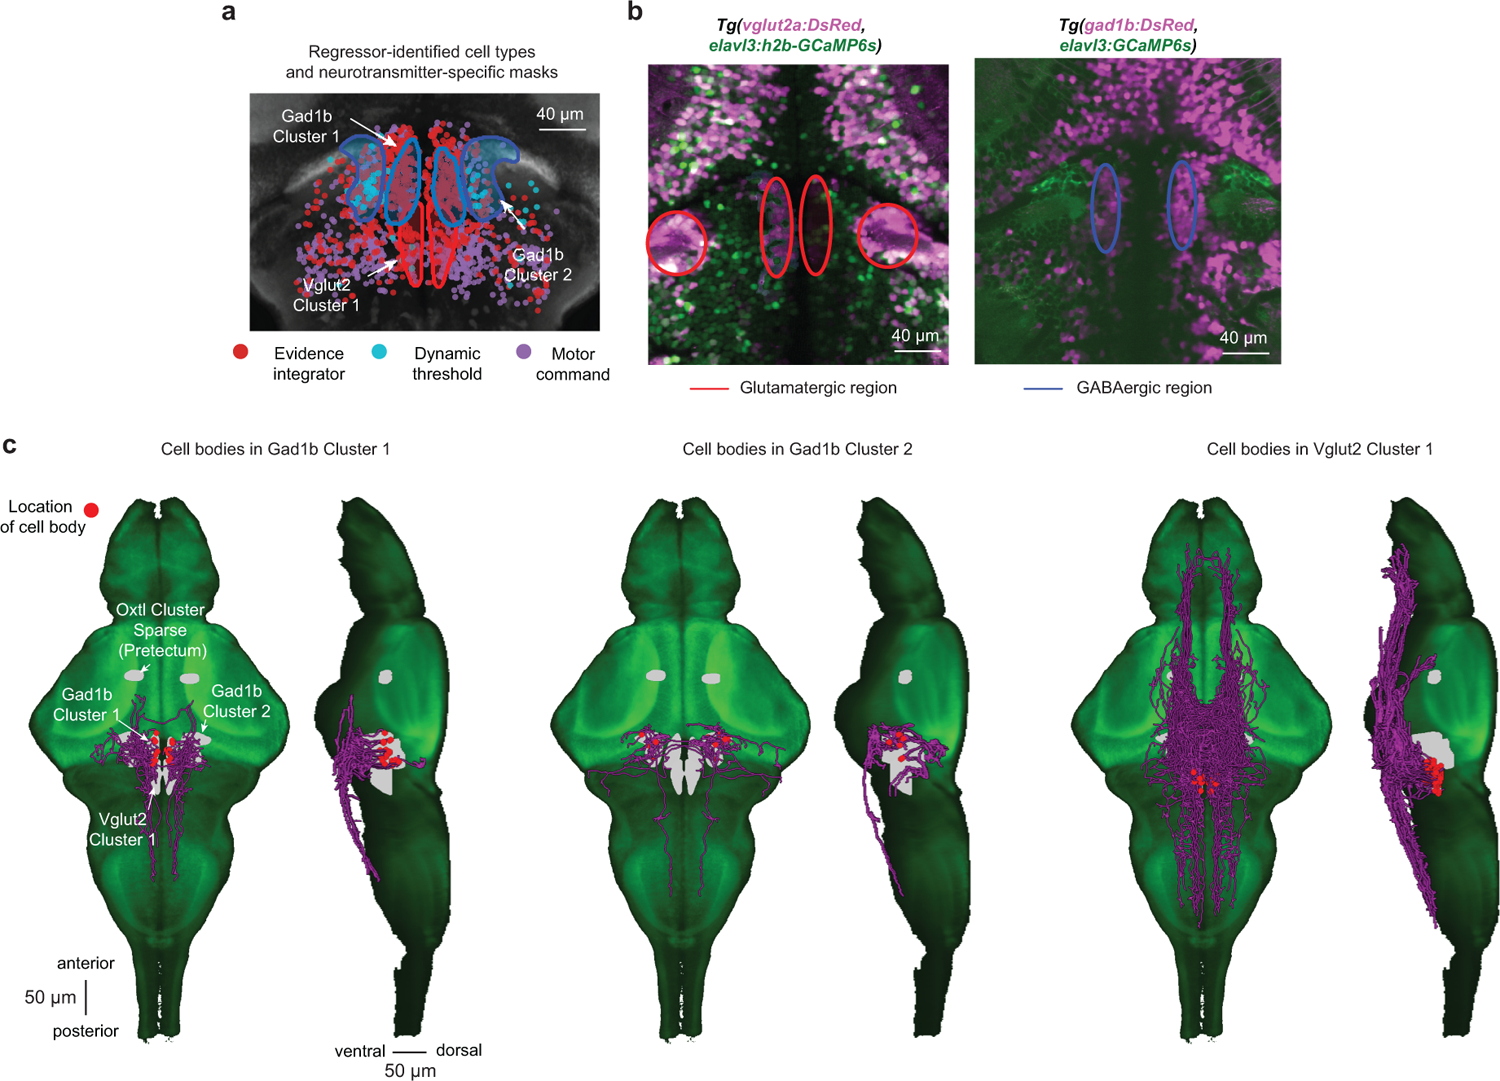
a, Overlay of neurotransmitter type-specific masks from the z-brain atlas (refs. 24 and 25) (glutamate = red outline; GABA = blue outline) with the functionally characterized cell types (same cells as in Fig. 3f) in the same coordinate system. Note that almost all identified dynamic threshold neurons lie within the Gad1b Cluster 2 and are, therefore, likely inhibitory. Please also note that the expression pattern of the vglut2a-driver line (ref. 25) suggests that the anatomical mask of the VGlut2 Cluster 1 likely extends even further into the anterior part of the hindbrain. b, Simultaneous imaging of DsRed (pink), expressed only in excitatory vglut2a+ neurons (left panel) or of DsRed expressed only in inhibitory gad1b+ neurons (right panel), and cytosolic or nuclear-localized GCaMP6s (green, pan-neuronal expression). Colored ellipses are manually added to highlight regions of interest. c, Single-cell morphologies with somata in the identified regions in the anterior hindbrain. Cells were mapped from the Max-Planck Zebrafish Brain Atlas (ref. 26) into the z-brain coordinate system and overlaid with the available masks (gray) on a GCaMP5G reference larval zebrafish (green). N = 6 fish in (a), same data as in Fig. 3f. N = 1 fish for each plot in (b).