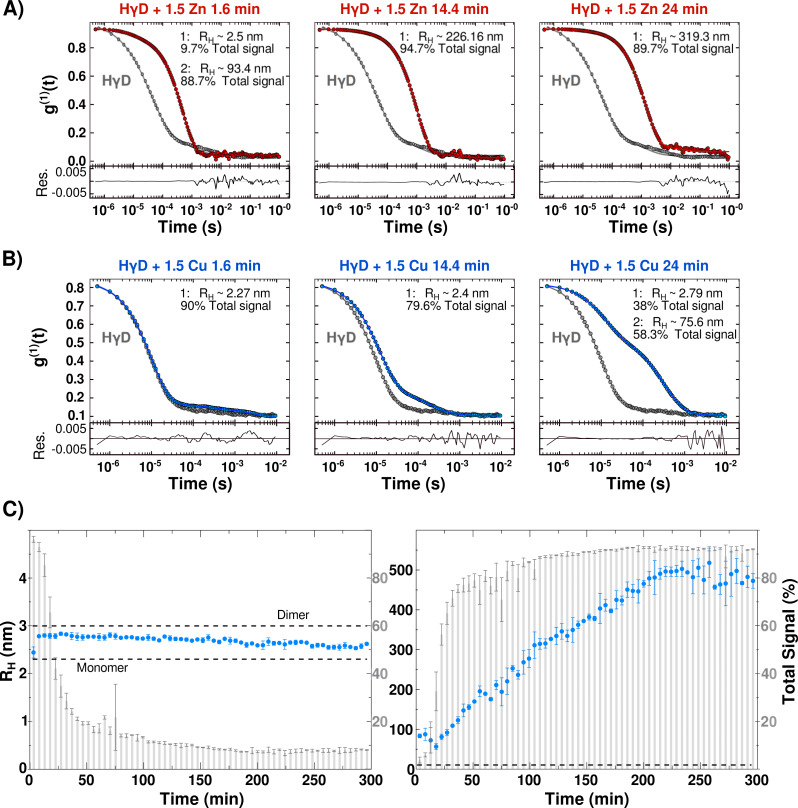
Figure 3. Protein oligomerization induced by metal-binding.
(A) Correlation coefficient of HγD in the absence (grey line) and presence of 1.5 equivalents of Zn(II) at 1.6 min (red), 14.4 min and 24 min after the addition of the metal ion. (B) Correlation coefficient of HγD in the absence (grey line) and presence of 1.5 equivalents of Cu(II) (blue) at 1.6 min, 14.4 min, and 24 min after the addition of the metal ion. Measurements of different times yielded a shift to the right indicating a size increase due to oligomerization. From the shape it can be seen that more than one species form part of the population sample. (C) Estimated hydrodynamic radius separated by the two species observe in the presence of Cu(II) as a function of time: small (monomeric) species (right) and the large species (left) (blue circles—right axes). The grey bars indicate the signal percentage of the species changes over time during the protein oligomerization kinetics (left axes). The predicted RH for HγD monomer and dimer calculated using HydroPRO are shown. All samples were centrifuged and filtered before measurements.

