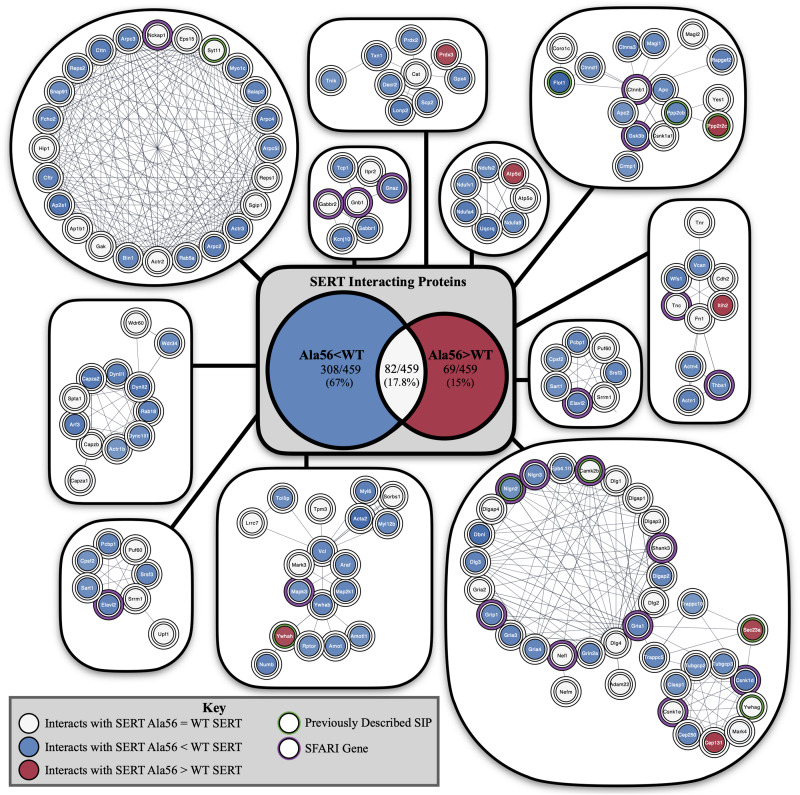
FIGURE 3.
STRING network analysis of all interacting proteins. Network of protein–protein interactions from the Cytoscape Omics Visualizer plug-in with STRING (confidence score cut-off of 0.9) followed by application of the MCL algorithm using clusterMaker2 app, with a minimum size of 7 proteins per cluster. Highlighted proteins previously identified to interact with SERT with a green outline and identified SFARI genes with a purple outline. Center shows Venn diagram of proteins with decreased interactions with SERT Ala56 compared to WT SERT (blue), number of proteins with increased interactions with SERT Ala56 compared to WT SERT (red) and number of proteins with similar interaction with both SERT Ala56 and WT SERT (light gray).

