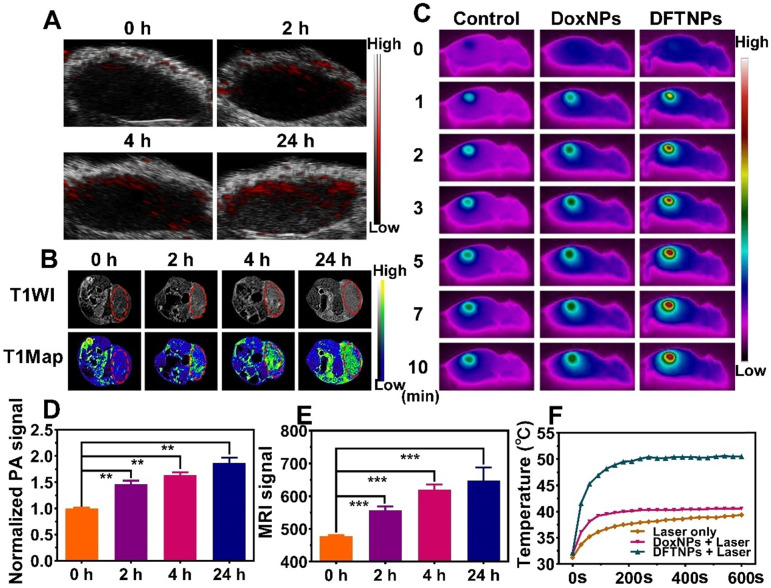
Figure 5.
In vivo multiple imaging and corresponding quantification analysis. (A) In vivo PA images of MDA-MB-231 tumor-bearing mice after intravenous injection of DFTNPs. (B) In vivo T1-weighted images and T1-mapping images of MDA-MB-231 tumor-bearing mice after intravenous injection of DFTNPs. (C) Photothermal images of tumor-bearing mice post various treatments. (D-E) Quantification analysis of normalized PA imaging signal and T1-weighted images within the tumor region at corresponding time points. (F) Temperature increase behaviors of tumor tissues in the mice post various treatments.

