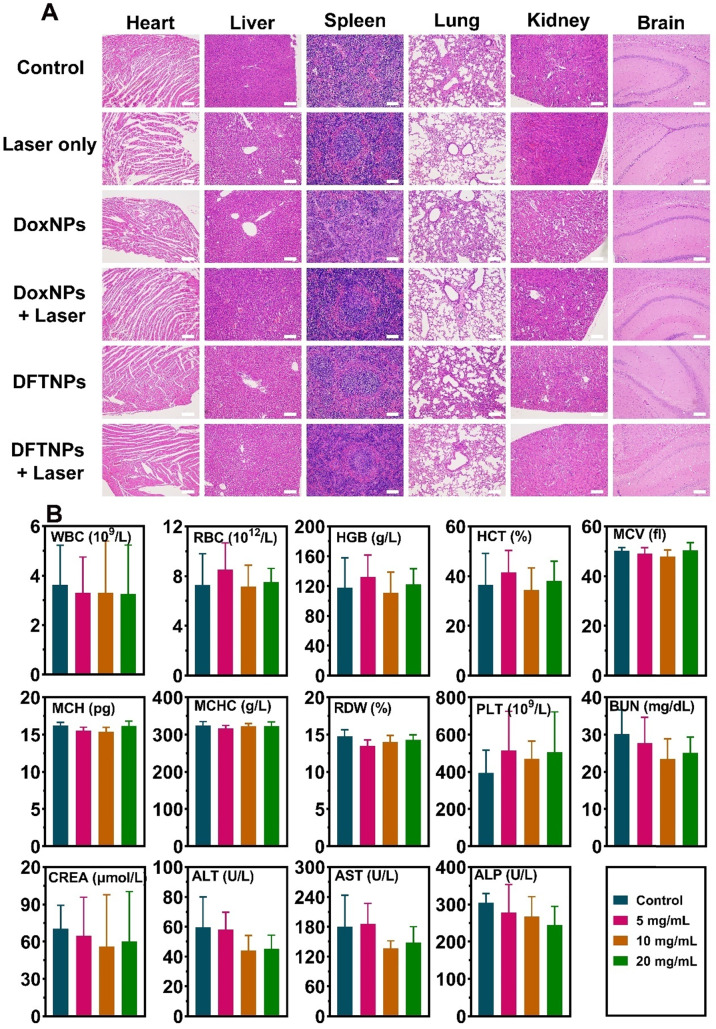
Figure 7.
In vivo histocompatibility of DFTNPs. (A) Histological sections of the heart, liver, spleen, lungs, kidneys, and brain from the mice after various treatments. Scale bars: 100 μm. (B) Histograms depicting variations in the routine blood test and blood biochemistry treated by DFTNPs with different doses over 30 d.

