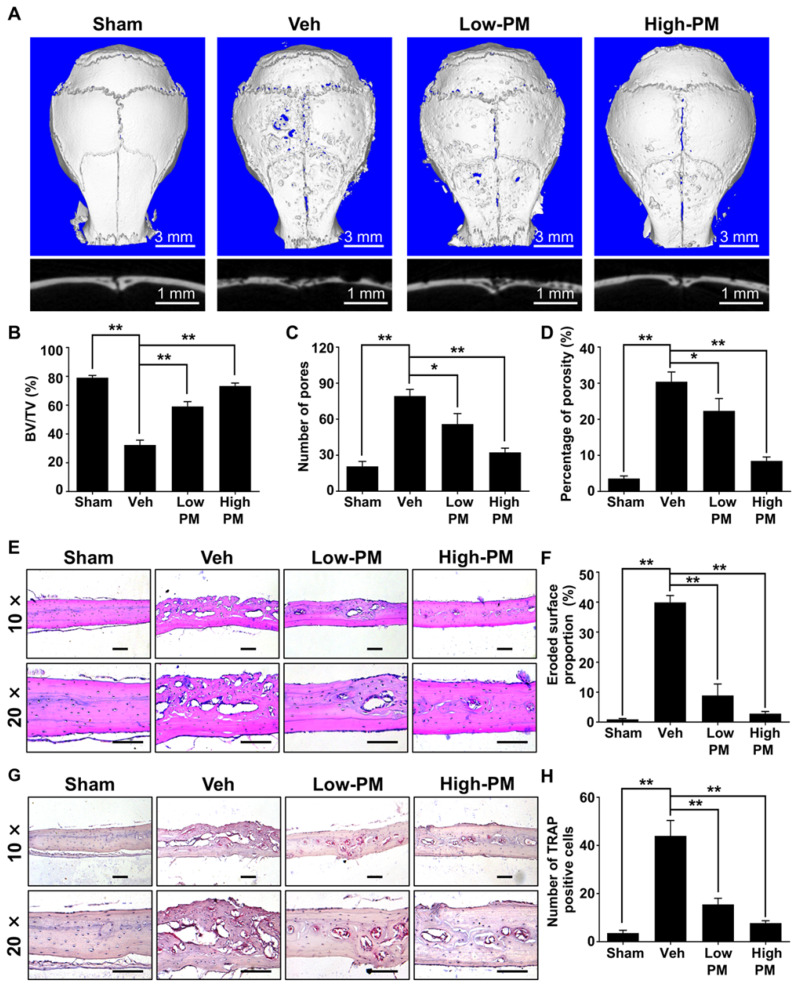
Figure 8.
Pharmacological activation of Hh signaling by PM attenuated Ti particle-induced osteolysis in vivo. (A) Representative 2D (bottom panels) and 3D (top panels) μCT images of calvariae from sham-operated mice (Sham) and Ti particle-implanted mice subjected to administration with vehicle (Veh), 2.5 mg/kg PM (Low-PM), or 10 mg/kg PM (High-PM). (B-D) Quantitative μCT analyses of bone architecture parameters including bone volume/total tissue volume (BV/TV) (B), number of pores (C) and percentage of porosity (D). (E) Representative images of H&E staining of calvarial sections from sham-operated mice (Sham) and Ti particle-implanted mice subjected to administration with vehicle (Veh), 2.5 mg/kg PM (Low-PM), or 10 mg/kg PM (High-PM). Scale bar, 100 μm. (F) Quantification of eroded surface proportion on H&E-stained calvarial sections. (G) Representative images of TRAP staining of calvarial sections from sham-operated mice (Sham) and Ti particle-implanted mice subjected to administration with vehicle (Veh), 2.5 mg/kg PM (Low-PM), or 10 mg/kg PM (High-PM). Scale bar, 100 μm. (H) Quantitative analyses of number of TRAP-positive multinucleated cells. All bar graphs were presented as mean ± SD. n=7 mice per group, *P<0.05, **P<0.01, determined by statistical analyses between two indicated groups.

