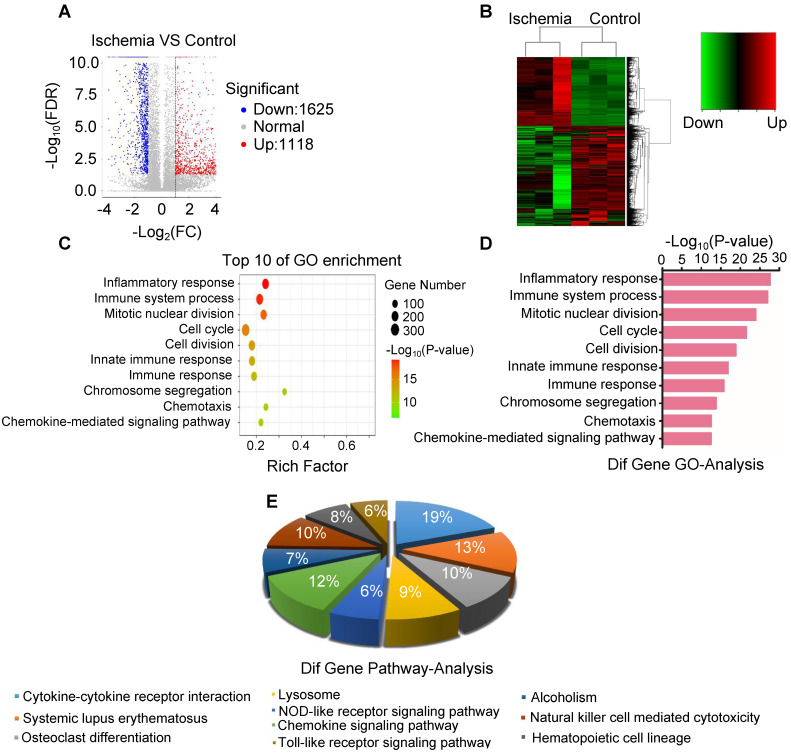
Figure 3.
Analysis of the expression of mRNA and associated pathway. (A) Volcano map of mRNA sequencing data from ischemic and control groups (blue, downregulated; red, upregulated). (B) Heatmap of mRNA sequencing data from ischemic and control groups (green, downregulated; red, upregulated). (C, D) Gene ontology (GO) in ischemic muscle compared with control group. (E) Analysis of top 10 pathways in ischemic muscle by mRNA sequencing.

