Figure 1.
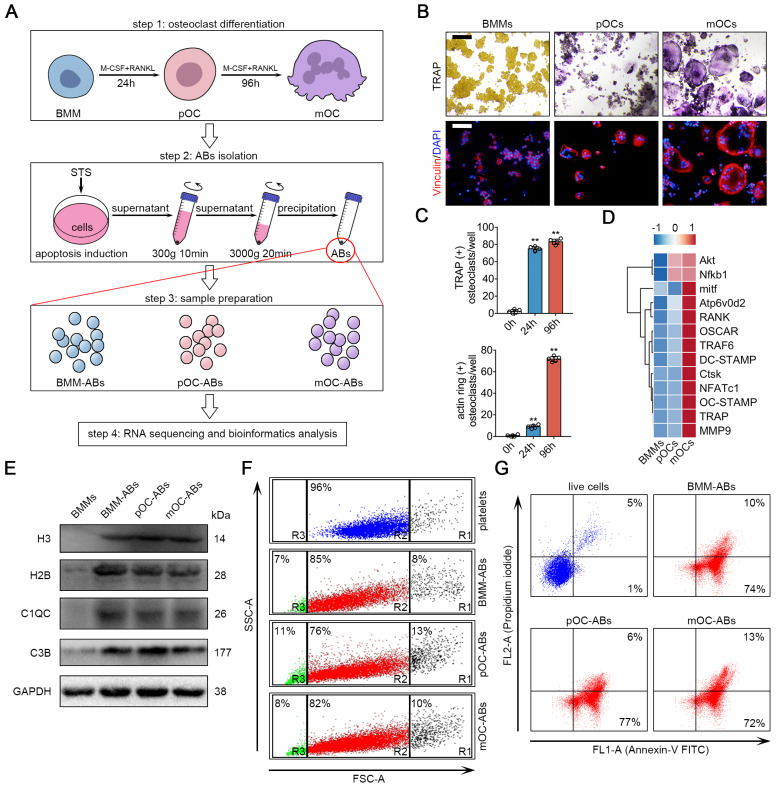
Generation and characterization of BMM-ABs, pOC-ABs and mOC-ABs. (A) Schematic diagram for osteoclast differentiation and the isolation of ABs from BMMs, pOCs and mOCs. (B) Representative TRAP stain and immunofluorescent (IF) staining images of bone marrow macrophages (BMMs), pre-osteoclasts (pOCs) and mature osteoclasts (mOCs). IF stain of vinculin (red) marking actin ring were shown. Bar represents 200 µm. (C) Quantification of TRAP positive cells number and actin ring positive cells number per well in B. (D) Gene array analysis showed the alteration of osteoclast specific genes expression from BMM to mOC. (E) Western blot analysis of H3, H2B, C1QC, C3B and GAPDH in indicated groups. (F) FSC/SSC analysis of BMM-ABs, pOC-ABs and mOC-ABs. Platelets (blue) were used as a size marker gating ABs (1-4 µm, gate R2). ABs derived from different periods of osteoclasts contains cell debris (gate R1), ABs (gate R2) and microparticles (gate R3). (G) Annexin V/FITC (FL1-A) and PI A (FL2-A) analysis of live cells, BMM-ABs, pOC-ABs and mOC-ABs. The quadrant gates were set on the respective unstained control population. The percentage of events is given in the right corner of indicated region. Images are representative of n = 5 independent experiments. The data in the figures represent the averages ± SD. Significant differences are indicated as * (p < 0.05) or ** (p < 0.01) paired using Student's t test unless otherwise specified.

