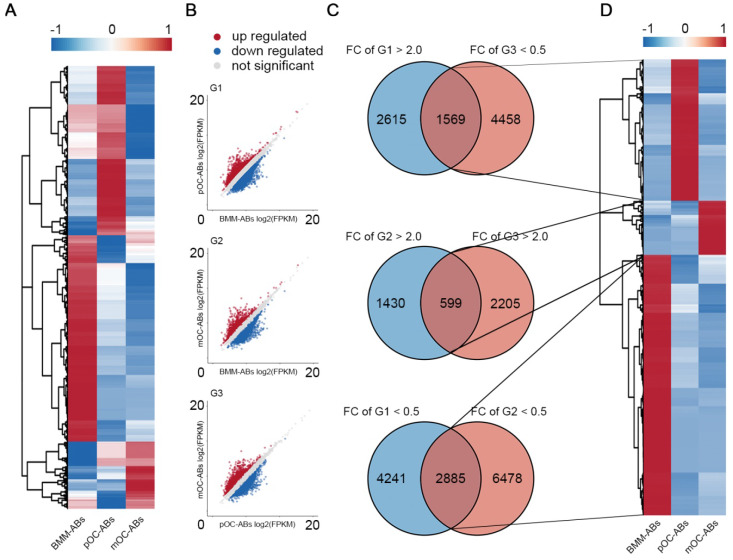
Figure 2.
lncRNA profiling of BMM-ABs, pOC-ABs and mOC-ABs. (A) Hierarchical clustering of all 20,889 lncRNAs expressed in BMM-ABs, pOC-ABs and mOC-ABs. (B) Scatter plots of all lncRNAs expressed in three comparison groups were shown. (C) VENN analysis screening out lncRNA signatures contained in three ABs. Corresponding lncRNA signatures were screened out using intersection of three comparison groups G1 (pOC-ABs vs BMM-ABs), G2 (mOC-ABs vs BMM-ABs) and G3 (mOC-ABs vs pOC-ABs). FC, fold change. (D) Hierarchical clustering of lncRNA signatures in three ABs.

