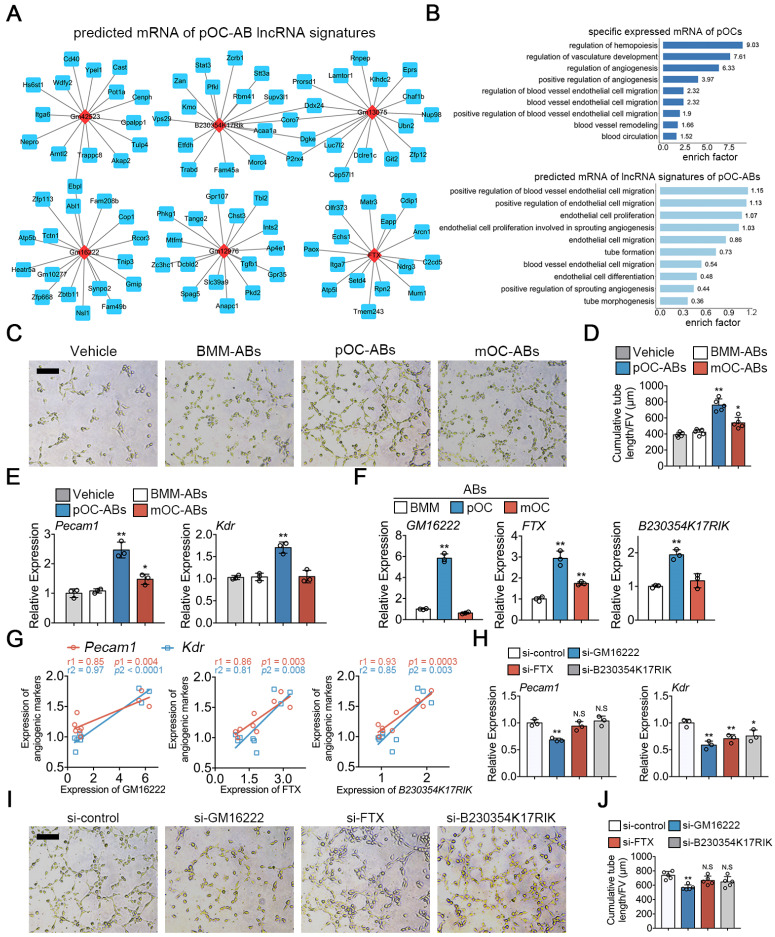
Figure 4.
Functional similarities of pOC-ABs with the parent cell pOCs. (A) Construction of the lncRNA-mRNA interaction network for top 6 most differentially expressed lncRNAs of pOC-ABs. Rhombic red nodes represent lncRNAs and square blue nodes represent mRNAs. (B) Angiogenesis related BP terms were shown by using GO enrichment analysis for specific expressed mRNA of pOCs or predicted target mRNAs of lncRNA signatures of pOC-ABs. (C) Representative Matrigel tube formation assay images of EPCs cultured with different AB-media. Bar represents 100 µm. (D) Quantitative analysis of cumulative tube length in (C), n = 5 per group. (E) Relative mRNA expression levels of Pecam1 and Kdr in EPCs cultured with different AB-media. (F) Relative expression levels of lncRNA GM16222, FTX and B230354K17RIK in pOC-ABs. (G) Correlations between lncRNA GM16222, FTX and B230354K17RIK with Pecam1 and Kdr. (H) Relative mRNA expression levels of Pecam1 and Kdr in EPCs cultured with pOC-AB-media with indicated treatments. (I) Representative Matrigel tube formation assay images of EPCs cultured with three lncRNA-knockdown pOC-ABs. Bar represents 100 µm. (J) Quantitative analysis of cumulative tube length in (I). Images are representative of n = 5 independent experiments. The data in the figures represent the averages ± SD. Significant differences are indicated as * (p < 0.05) or ** (p < 0.01) paired using Student's t test unless otherwise specified.

