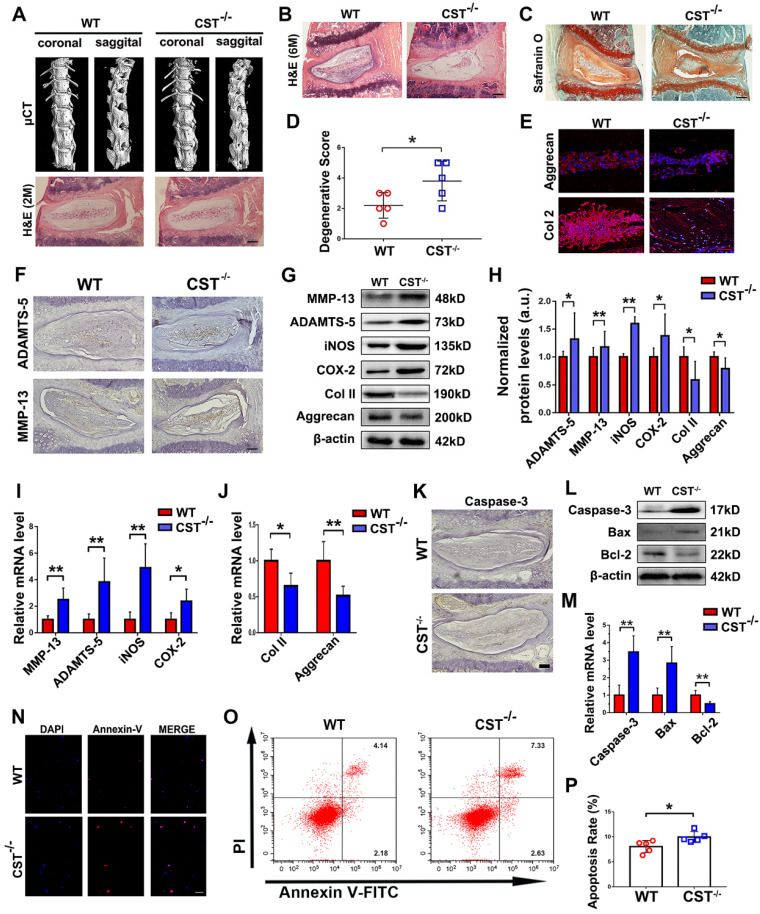
Figure 2.
CST deficiency contributed to accelerated IVD degeneration in mice. (A) Representative µCT images of the spine and H&E staining of the IVDs from 2-month-old WT and CST-/- mice revealed no overt degeneration in CST-/- mice (n=7). Scale bar, 150 µm. (B) H&E staining of 6-month-old WT and CST-/- mice (n=5). Scale bar, 150 µm. (C-D) Safranin O staining of 6-month-old CST-/- mouse IVD tissues and appended degenerative scores indicated accelerated IVD degeneration compared with that in the WT littermates (n=5). Scale bar, 150 µm. (E) Immunofluorescence to detect Aggrecan and Col 2 in IVD tissues from 6-month-old WT and CST-/- mice (n=5). Scale bar, 150 µm. (F) Immunohistochemistry to detect ADAMTS-5 and MMP-13 in IVD tissues from 6-month-old WT and CST-/- mice (n=5). Scale bar, 150 µm. (G-H) Western blot analysis of catabolic markers (MMP-13 and ADAMTS-5), inflammatory molecules (iNOS and COX-2) and anabolic markers (Col 2 and Aggrecan) from 6-month-old WT and CST-/- mice (n=5) and analysis of the normalized protein levels in each group. (I-J) Real-time PCR to detect catabolic markers (MMP-13 and ADAMTS-5), inflammatory molecules (iNOS and COX-2) and anabolic markers (Col 2 and Aggrecan) from 6-month-old WT and CST-/- mice (n=5). Total mRNA was collected from each indicated group, and real-time PCR was performed. Normalized values were calibrated against the wild-type (WT) group and given a value of 1. (K) Expression of caspase-3 in IVD tissues was elevated in 6-month-old CST-/- mice compared with WT littermates, as detected by immunohistochemistry (n=5). Scale bar, 150 µm. (L) Expression of caspase-3, bax and bcl-2 was detected by Western blot analysis (n=5). Total protein was collected from the IVD tissues of 6-month-old WT and CST-/- mice, and Western blot analysis was performed. (M) Expression of caspase-3, bax and bcl-2 was examined by real-time PCR (n=5). Normalized values were calibrated against the wild-type (WT) group and given a value of 1. (N) Immunofluorescence to detect Annexin-V in NP cells isolated from 6-month-old WT and CST-/- mice (n=5). Nuclei were stained with DAPI. Scale bar, 100 µm. (O) Quantification of NP cell apoptosis in the WT and CST-/- mice, as detected by flow cytometry (n=5). (P) Apoptosis rates in the two groups. *p<0.05 and **p<0.01 vs. the WT group. Data are presented as the mean ± SD.

