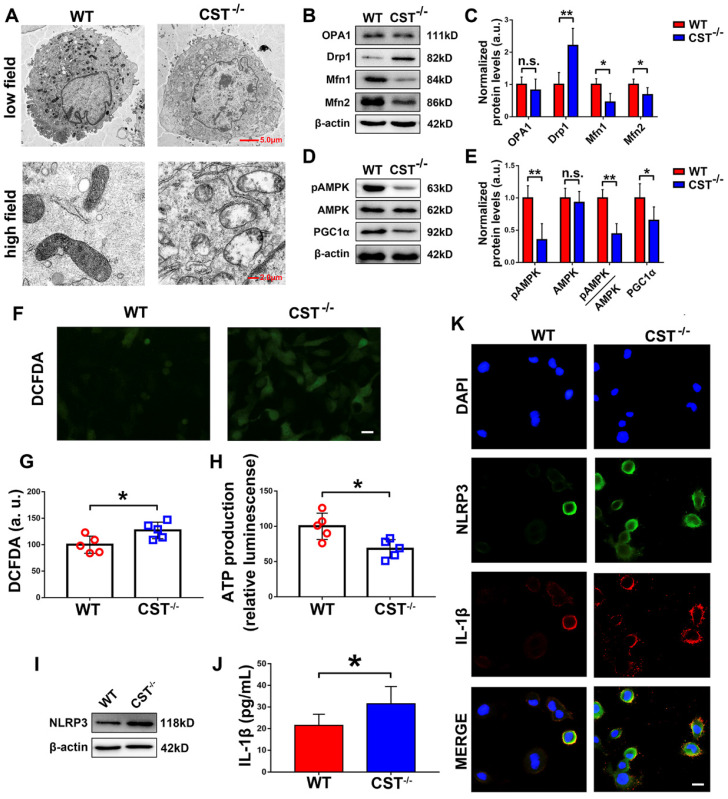
Figure 3.
CST knockout exaggerated mitochondrial ROS-dependent activation of the NLRP3 inflammasome. (A) Representative TEM images of the mitochondria in NP cells from WT and CST-/- mice (n=5). A low-field image of a whole cell and magnified high-field images of swollen mitochondria are shown. Scale bars, 5 µm (upper panel), 2 µm (lower panel). (B-C) Western blot analysis of the mitochondrial morphology-related proteins Drp1, OPA1 and Mfn1/2 and analysis of the normalized protein levels (n=5). Total protein was collected from NP cells isolated from WT and CST-/- mice. (D-E) Western blot analysis of pAMPK, AMPK and PGC1α, key regulators of mitochondrial biogenesis and dynamics, and analysis of the normalized protein levels (n=5). Total protein was collected from NP cells isolated from WT and CST-/- mice. (F-G) Representative images and quantification of ROS levels in the WT and CST-/- groups (n=5). Scale bar, 20 µm. (H) ATP production in the WT and CST-/- groups (n=5). (I) Western blot analysis of NLRP3 in the WT and CST-/- groups (n=5). (J) The expression of IL-1β in culture media supernatants from the WT and CST-/- groups, as detected by ELISA (n=5). (K) Representative images of NLRP3 and IL-1β expression in the WT and CST-/- groups, as assayed by immunofluorescence (n=5). Nuclei were stained with DAPI. Scale bar, 20 µm. *p<0.05 and **p<0.01 vs. the WT control group. n.s., not significant. Data are presented as the mean ± SD.

