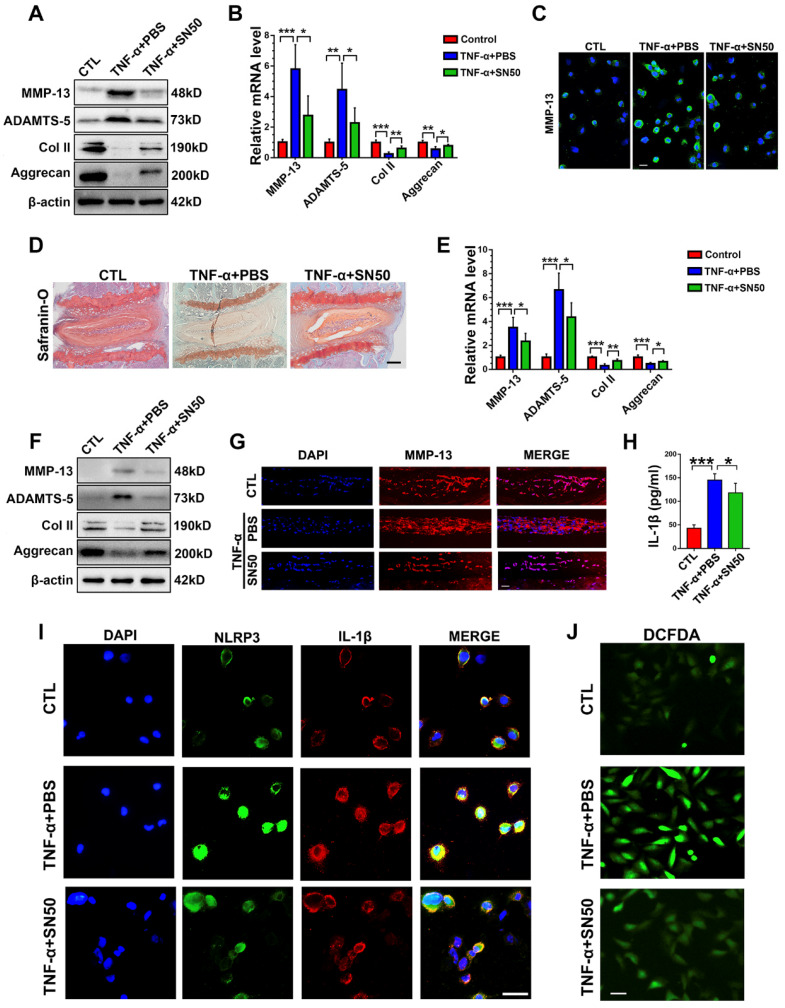
Figure 7.
CST mimics the role of SN50 in inhibition of the NF-κB signalling pathway. (A) Western blot analysis of MMP-13, ADAMTS-5, Col 2 and Aggrecan in CST-/- NP cells (n=5). Primary CST-/- NP cells were cultured under TNF-α, stimulation with or without additional treatment with SN50, followed by Western blot analysis. (B) Relative mRNA expression of MMP-13, ADAMTS-5, Col 2 and Aggrecan in murine NP cells from CST-/- mice, as measured by real-time PCR (n=5). (C) Immunofluorescence of MMP-13 in murine NP cells from CST-/- mice (n=5). Scale bar, 20 µm. (D) Safranin O staining of ex vivo-cultured CST-/- murine IVD tissues in each indicated group (n=5). Scale bar, 150 µm. (E) Relative mRNA expression of MMP-13, ADAMTS-5, Col 2 and Aggrecan in ex vivo-cultured CST-/- murine IVD tissues, as measured by real-time PCR (n=5). (F) Western blot analysis of MMP-13, ADAMTS-5, Col 2 and Aggrecan in ex vivo-cultured CST-/- murine IVD tissues of each indicated group (n=5). (G) Immunofluorescence of MMP-13 in the ex vivo-cultured CST-/- murine IVD tissues of each indicated group. (n=5). Scale bar, 100 µm. (H) Expression of IL-1β in the culture media of groups of murine CST-/- NP cells, as detected by ELISA (n=5). (I) Representative images of NLRP3 and IL-1β immunofluorescence in the murine CST-/- NP cells of each indicated group (n=5). Scale bar, 20 µm. (J) Representative images of ROS levels in the murine CST-/- NP cells of each indicated group (n=5). Scale bar, 20 µm. *p<0.05, **p<0.01 and ***p<0.001 vs. the indicated control group. Data are presented as the mean ± SD.

