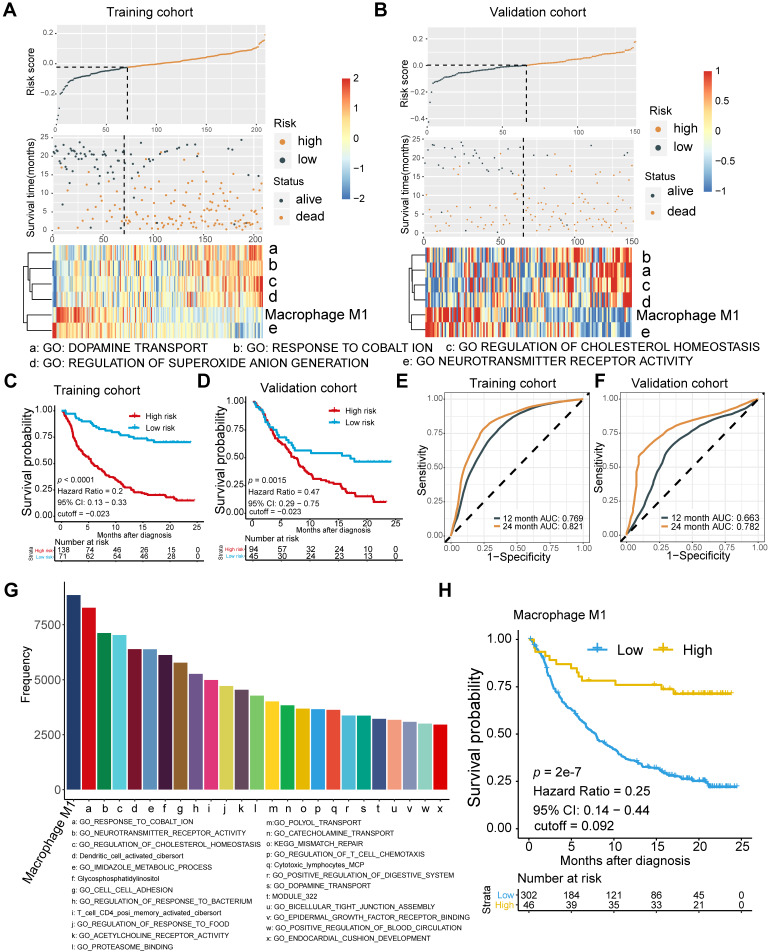
Figure 1.
Signature profile of training and validation cohort highlights M1 macrophage as latent biomarker. (A-B) Establishment of a prognosis-predictive model dividing patients into high and low risk groups (A) and its validation (B). M1 macrophages and other metabolic pathways crucially contributed to the model were shown. Risk score and cutoff value on the top; Survival statues on the Middle; Gene expression heatmap (red: high expression; blue: low expression) of varying signatures selected by Lasso algorithm on the bottom. Feature selection processes and Feature matrix used to develop lasso model are displayed in Figure S1 and Table S2 and S3. (C-D) Risk score derived from the constructed model was significantly correlated with overall survival (Kaplan-Meier survival analyses, Training cohort: p < 0.0001, Hazard Ratio = 0.2, 95% CI: 0.13 - 0.33; Validation cohort: p < 0.0001, Hazard Ratio = 0.42, 95% CI: 0.27 - 0.63). (E-F) The established model held promise in predicting 12-month and 24-month survival. (Training cohort: 12-month AUC = 0.769, 24-month AUC = 0.821; Validation cohort: 12-month AUC = 0.663, 24-month AUC = 0.782). (G) Frequency of gene signatures selected by Lasso-bootstrapping highlighted the prominence of M1 macrophage contributing to predictive model. (H) M1 microphage infiltration was positively correlated with overall survival (p = 2e-7, Hazard Ratio = 0.25, 95% CI: 0.14 - 0.44).

