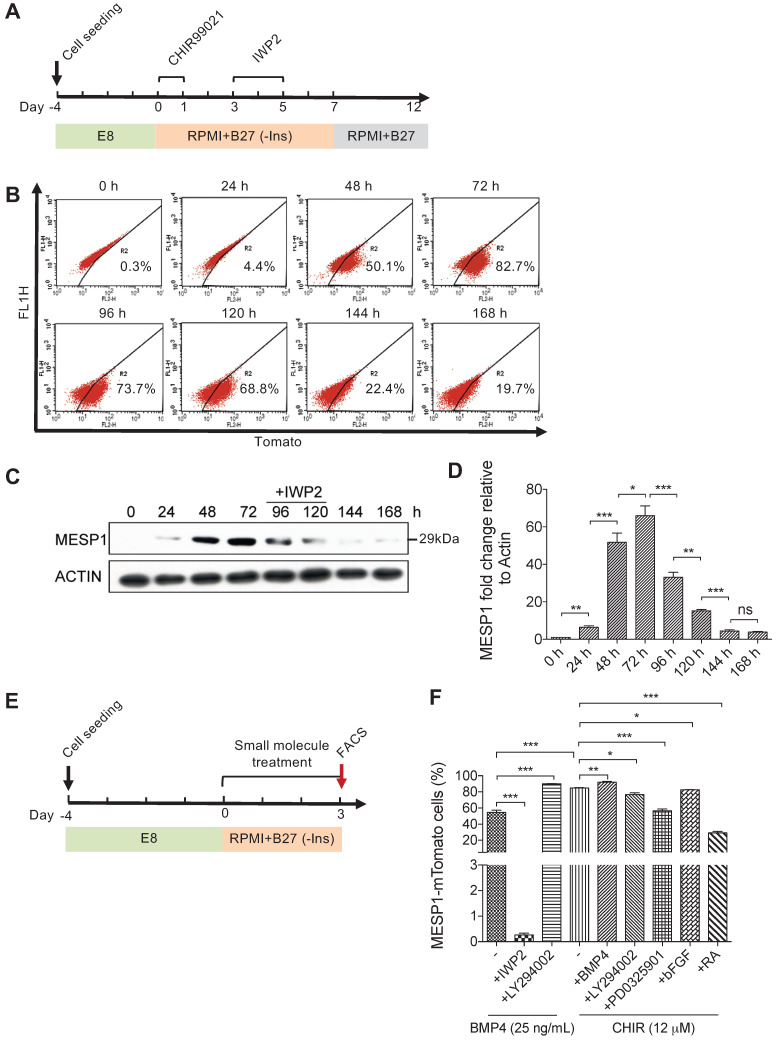
Figure 2.
Canonical Wnt signaling controls the induction of MESP1-mTomato+ cells. (A) Cartoon depicting the CM differentiation protocol. (B) Flow cytometry analysis of mTomato fluorescence in cells during 168 h (7 days) of CM differentiation (n = 3). (C) Western blot showing endogenous MESP1 protein levels during CM differentiation (n = 3). (D) Quantification of MESP1 protein level based on the western blot. (E) Experiment timeline for signaling pathway test: 4 days after replating and culturing in E8 medium, MESP1-mTomato reporter cells were treated with small molecules activating or inhibiting various signaling pathways for 72 h, then harvested for flow cytometry analysis. (F) Bar graph quantification of MESP1-mTomato+ cell percentage after growth factor or small molecule treatment (as listed at the bottom) (n = 3). “-” no small molecule added. Data is shown as mean ± SEM, *p < 0.05, **p < 0.005, ***p < 0.001, Student's t-test.

