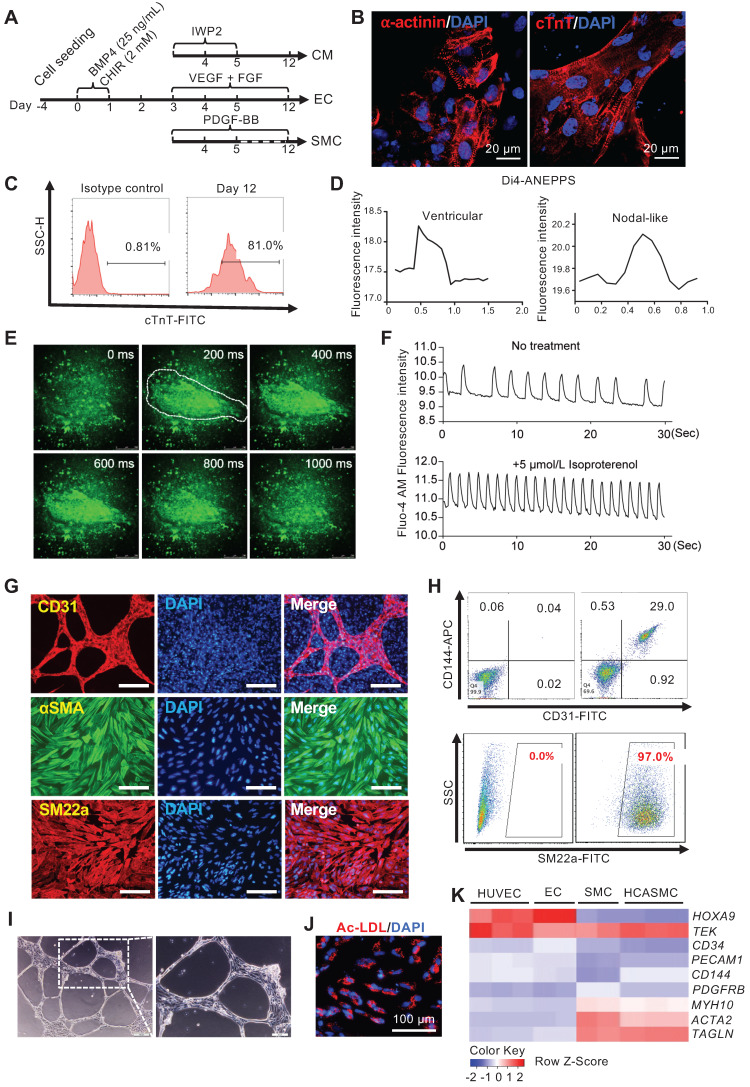
Figure 5.
Efficient tri-lineage differentiation based on optimizing MESP1-mTomato expression. (A) Schematic view of the tri-lineage differentiation system. (B) Immunostaining of α-actinin (red) and cTnT (red) in CMs, DNA in blue, scale bars, 20 µm. (C) Flow cytometry analysis of cTnT+ cells on day 12. (D) Di-4-ANEPPS fluorescence intensity measurement to show the action potential change in MESP1-mTomato+ cells derived CMs. Most beating cells showed ventricular-like electrophysiology characteristics (left), and some displayed nodal-like potential change (right). (E) Time-lapse images of Ca2+ transients in CMs. The time was indicated on the top-right corner; the white line circled the contracting area. (F) Drug response of CMs differentiated from MESP1-mTomato+ cells. Beating cells stained with Fluo-4 AM were first filmed. Then they were treated with 5 µmol/L Isoproterenol and filmed again. Images were recorded at 10 frames per second. Fluorescence intensity of the circled area in (E) was quantified before and after Isoproterenol addition. (G) Immunostaining of CD31 (red), αSMA (green) and SM22a (red). Scale bars, 100 µm. (H) Flow cytometry analysis of CD31-CD144 for ECs and SM22a for SMCs. (I) Tube formation assay of ECs. Scale bar, 10 µm. (J) DiI-ac-LDL (red) uptake assay, scale bar, 100 µm. (K) Heatmap comparison of marker gene expression among HUVEC, MESP1 cells derived EC, SMC, and HCASMC.

