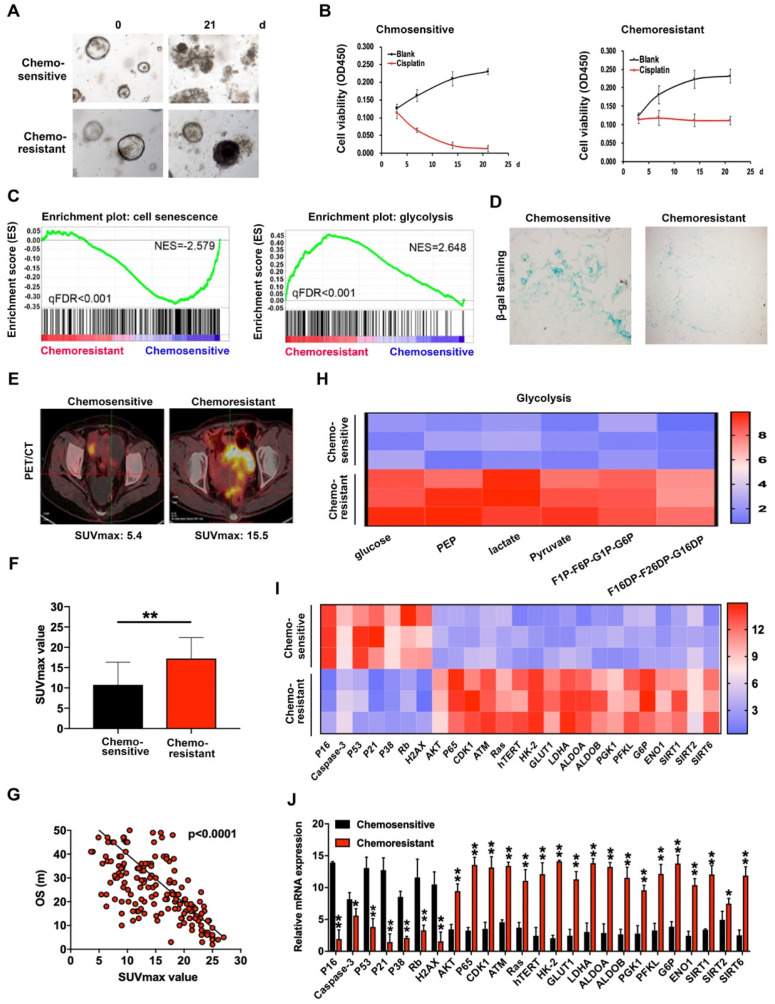
Figure 1.
Cisplatin-resistance is closely associated with cell senescence and glucose metabolism in organoids of ovarian cancer. (A) Images of cisplatin-sensitive and -resistant PDOs of ovarian cancer with 3ug/L cisplatin treatment on days 0 and 21. (B) Cell viability assay of PDOs treated with 3 µg/L cisplatin in different time intervals. (C) GSEA analysis was performed using cisplatin-sensitive and cisplatin-resistant PDOs of ovarian cancer. The signature was defined by genes with significant expression changes. (D) Representative images of β-galactosidase staining in cisplatin-sensitive and cisplatin-resistant ovarian cancer tissues. (E and F) The relationship between SUVmax value of PET/CT image and chemosensitivity in ovarian cancer patients. SUVmax value of PET/CT scan in 100 cisplatin-sensitive and 100 cisplatin-resistant ovarian cancer patients were analyzed. (G) The association between SUVmax value of PET/CT image and overall survival in ovarian cancer patients. SUVmax value of PET/CT scan in 200 ovarian cancer patients were analyzed. (H) Metabolites in glycolysis pathway. (I) and (J) Heat map (I) and histogram (J) of qRT-PCR analysis of indicated genes in cisplatin-sensitive and cisplatin-resistant ovarian cancer organoids. Data were shown as mean ± SD. Significance was calculated using the Student t test. *P < 0.05, **P < 0.01.

