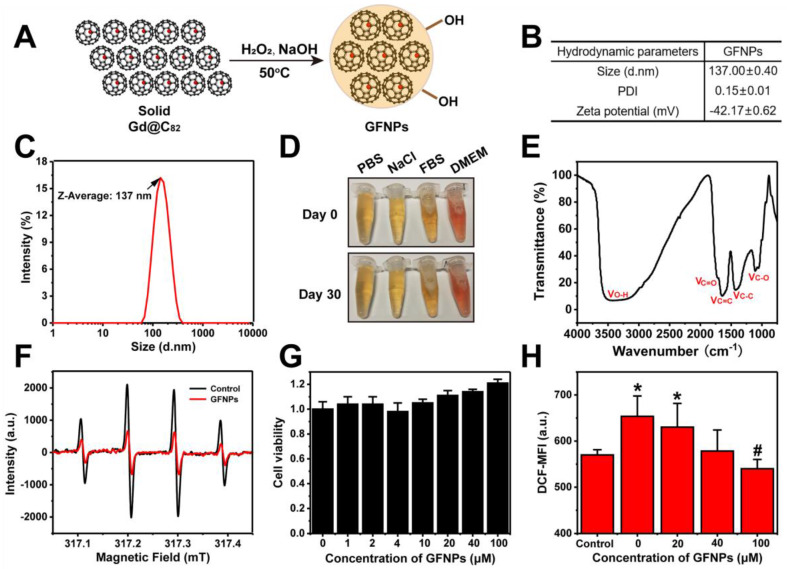
Figure 1.
Preparation and Characterization of GFNPs. (A) Schematic diagrams of the synthesis of GFNPs. (B) The average size, polydispersity index (PDI) and Zeta potential of GFNPs in water. (C) Hydrodynamic size distribution of GFNPs by DLS. (D) Optical photographs of GFNPs in PBS (1x), 0.9 % NaCl, FBS and DMEM-H, on day 0 (up) and day 30 (down) after synthesized. (E) The FT-IR spectrum of GFNPs. (F) The ESR spectra of •OH captured by DMPO after treated with the ultrapure water (black line) or 30 µM GFNPs (red line). (G) The FDC-P1 cell viability after treatment with GFNPs (0, 1, 2, 4, 10, 20, 40, 100 µM). (H) The intracellular ROS levels of FDC-P1 cells treated with different concentrations of GFNPs (0, 20, 40, 100 µM) after treatment with H2O2 (400 µM) in dark for 1 h. (n≥3; *p < 0.05, vs Control group; # p < 0.05, vs only H2O2-treatment group).

