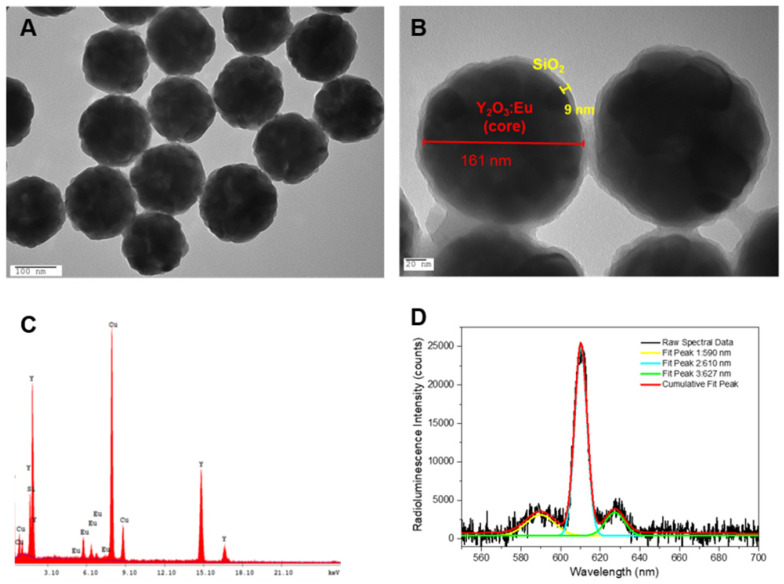
Figure 1.
Characterization of Y2O3:Eu@SiO2. TEM images of (A) Y2O3:Eu and (B) Y2O3:Eu@SiO2; (C) EDX analysis of Y2O3:Eu@SiO2 particles, and (D) Typical radioluminescence spectra showing dominant emission peaks at 590, 610 nm, and 627 nm, as well as their corresponding, independent Gaussian curve-fits.

