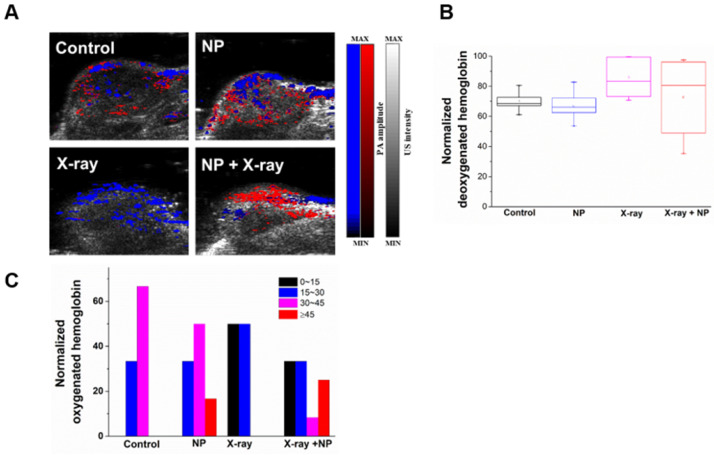
Figure 8.
Validation of hypoxic conditions observed in photoacoustic images in vivo. (A) Oxygen saturation of a representative tumor cross-section profiled by photoacoustic image. (B) Mean deoxygenated hemoglobin of each group after X-ray irradiation. (C) Illustrations of the heterogeneous oxygenated hemoglobin distribution of different treatment groups.

