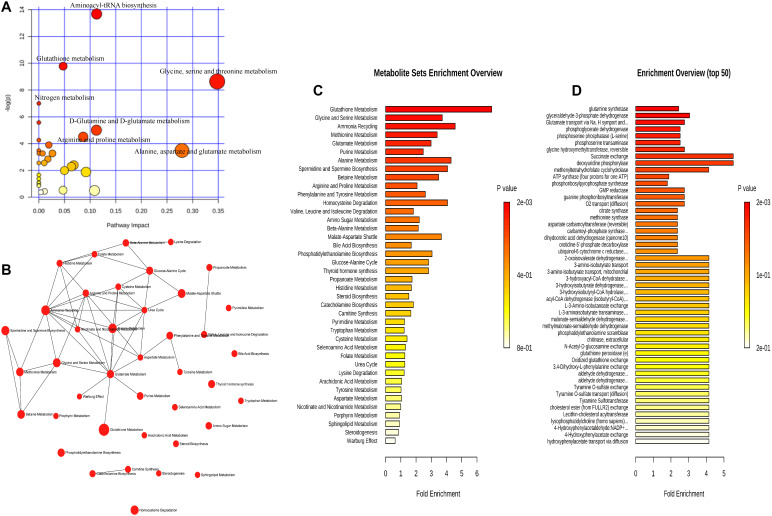
FIGURE 6.
The decreasing metabolic pathways involved in dry eye disease. The 31 decreasing metabolites were subjected to analysis with Metaboanalyst to generate a topology map (A), enrichment analysis network and table for the pathway-associated metabolite sets (B,C), and enrichment analysis table for the predicted metabolite enzyme sets (D).

