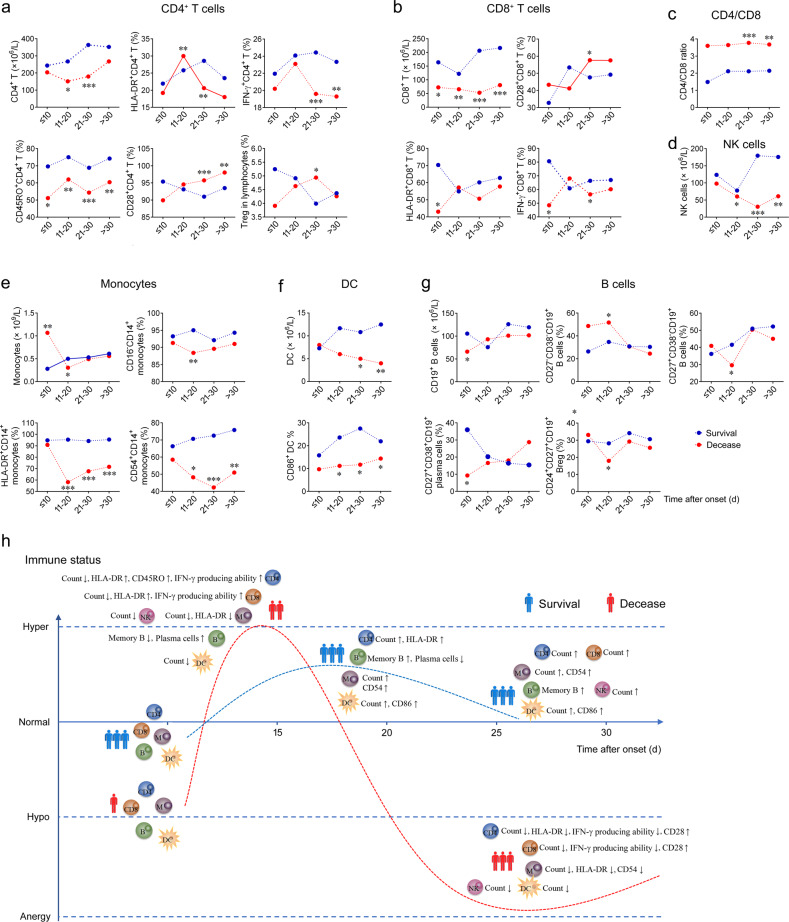
Fig. 1.
Cellular immune responses during COVID-19. a Absolute number of CD4+ T cells, frequencies of HLA-DR+, IFN-γ+, CD45RO+, and CD28+ cells within CD4+ T cells, and CD25highCD127low regulatory T cells within lymphocytes in COVID-19 patients. b Absolute number of CD8+ T cells and frequencies of CD28+, HLA-DR+, and IFN-γ+ cells within CD8+ T cells in COVID-19 patients. c, d Ratio of CD4/CD8 and absolute number of NK cells (d) in COVID-19 patients. e Absolute number of monocytes and frequencies of CD16−, HLA-DR+, and CD54+ cells within monocytes in COVID-19 patients. f Absolute number of DC and frequency of CD86+ cells within DC in COVID-19 patients. g Absolute number of CD19+ B cells and frequencies of B-cell subsets within total B cells in COVID-19 patients. The mean values of results in different stages were shown in line graph. Data are compared between survived and deceased patients in the same stage of disease. *p < 0.05, **p < 0.01, ***p < 0.001 (Mann–Whitney U test). h The simulated diagram shows the characteristics of immune responses in survived and deceased COVID-19 patients with different onset time (↑or↓means that the mean value in the described stage is increased or decreased compared with the result in the early stage, respectively)

