FIGURE 7.

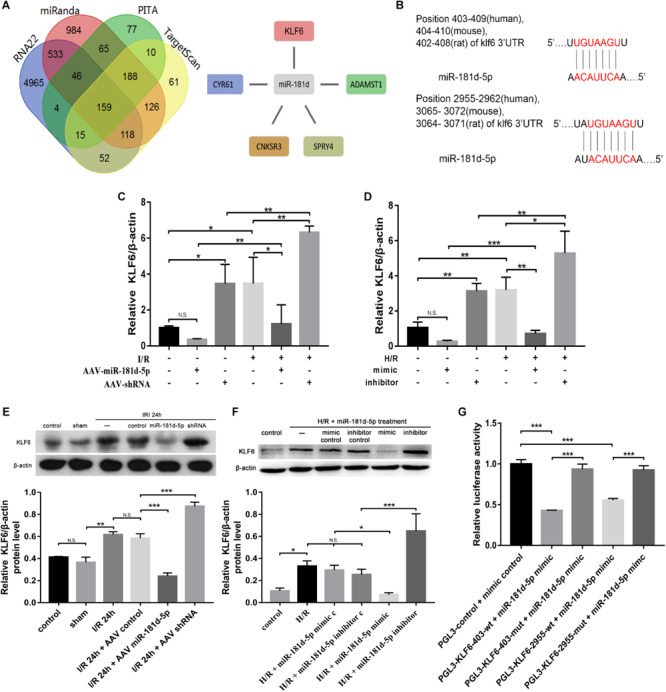
Overexpression of miR-181d-5p inhibited KLF6 expression. (A) The four regions indicate the numbers of miRNA-181d target genes obtained via different software packages. The intersecting regions indicate that multiple software packages predicted the same numbers of target genes. The expression of five miRKA-181d target genes (CYR61, CNKSR3, SPRY4, KLF6, ADAMTSI) was increased in AKI (FDR < 0.05, expression level change > 2-fold). (B) Schematic representation of the putative miR-181d-5p target sites in the 3’UTR of mouse, rat, and human KLF6. (C,E) qRT-PCR and Western blot analyses of KLF6 in mice, mRNA and protein were extracted from kidney cortical tissues for analysis of KLF6, B-Actin was used as the reference gene. For quantification, the KLF6 bands were analyzed by densitometry, and the band densities were expressed as the ratios to β-actin (C: n = 5 per group; E: n = 3 per group). (D,F) qRT-PCR and Western blot analyses of KLF6 expression in HK-2 cells. Cells were transfected with the miR-181d-5p mimic or miR-181d-5p inhibitor, and the miR-181d-5p mimic control or miR-181d-5p inhibitor control was used as the respective control. Whole-cell lysates were collected for analysis after transfection for 72 h and treatment with hypoxia for 24 h/reoxygenation for 3 h (D: n = 5 per group; F: n = 3 per group). (G) KLF6 3’UTR activity assay. EGFP-miR-181d-5p and RFP-KLF6 3’UTR plasmids containing fluorescent constructs were co-transfected into 293T cells with or without scrambled or mutant plasmids. The fluorescence intensity was determined 48 h after transfection. The ratio of the normalized sensor fluorescence intensity to the control fluorescence intensity is shown (n = 3 per group). The data are presented as the means ± SDs, *P < 0.05, **P < 0.01, ***P < 0.001.
