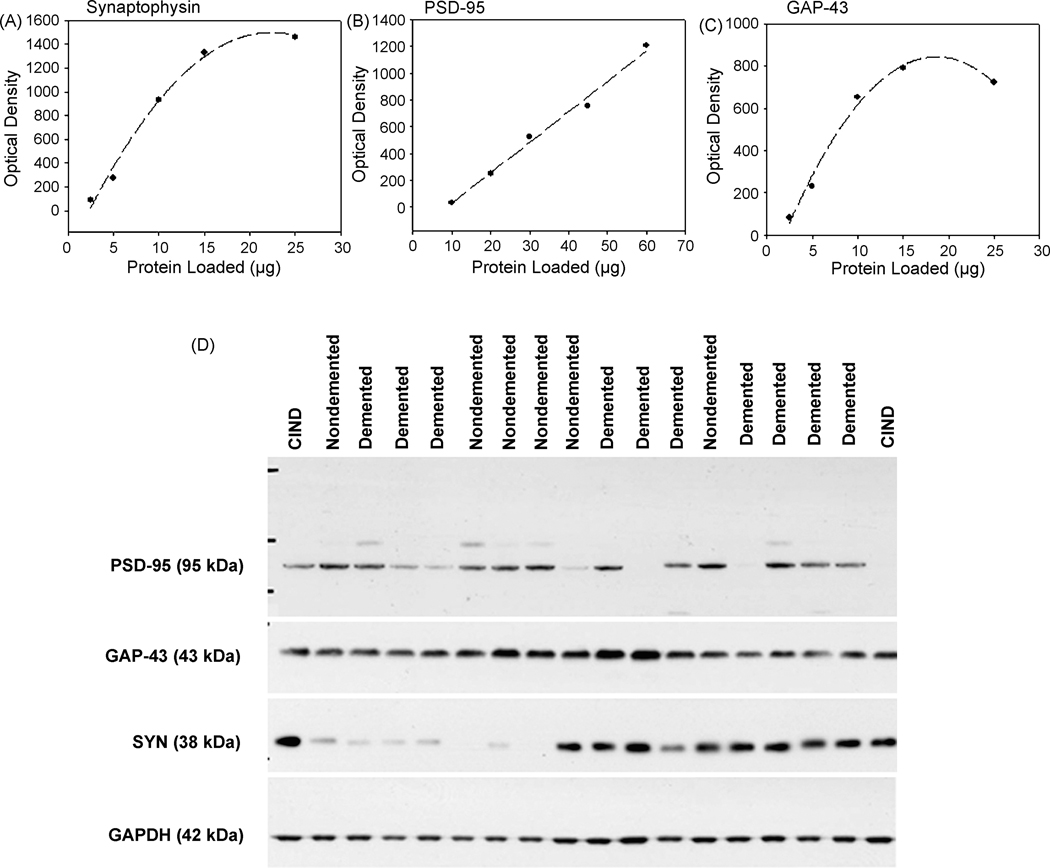
Figure 1.
Quantification of frontal cortex synapse proteins in the oldest-old. All protein levels for individual synapse markers were established based on loading increasing concentrations of pooled homogenates of frontal cortex tissue to establish optimal amounts for quantifying synaptophysin (SYN)</P/> (A) PSD-95 (B) and for GAP-43 (C). Lines indicate either linear or logistic regression. Representative western blots of PSD-95, GAP-43 and SYN are shown for a subset of oldest-old cases used in the current study along with a protein loading control (GAPDH) (D).

