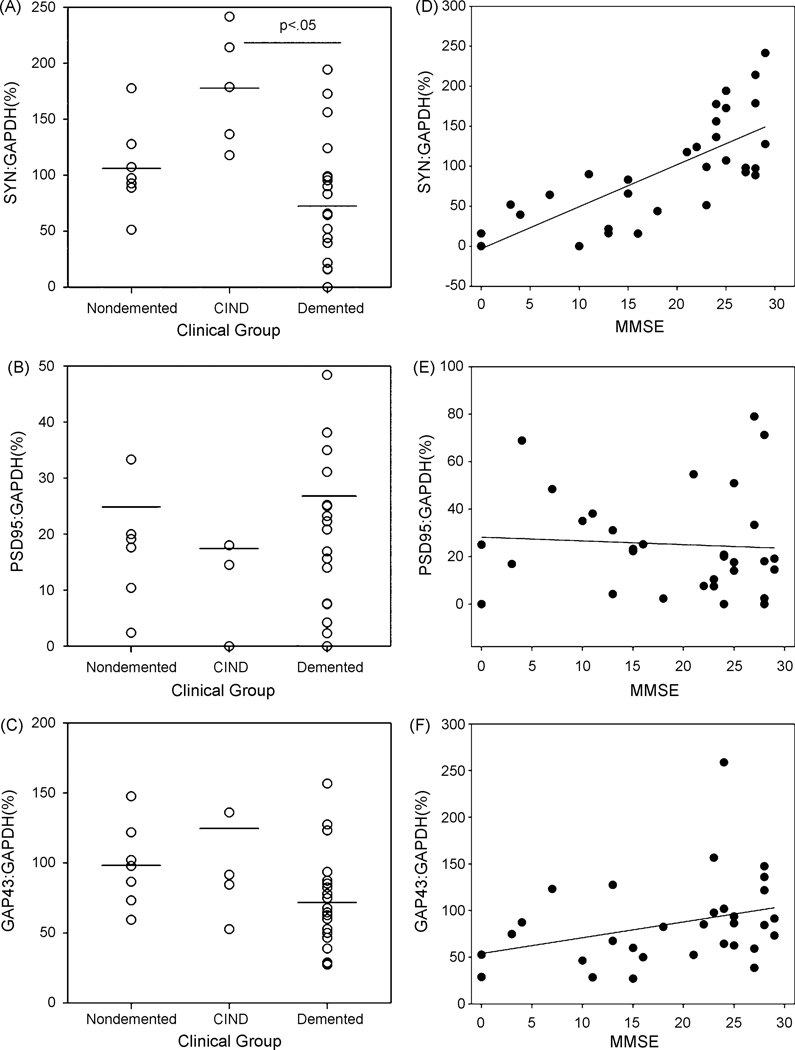
Figure 2.
Protein levels as a function of clinical diagnosis in the oldest-old. SYN protein levels were highest in individuals that were cognitively impaired but not demented (CIND) relative to cases with dementia (A). There was no difference in PSD-95 levels in the three clinical groups (B) and there was a trend towards higher GAP-43 in CIND cases (C) This trend was primarily due to one subject with very high GAP-43 protein levels. SYN protein levels in the frontal cortex were also significantly correlated with overall cognitive function measured by the MMSE (r=0.73)(D). However, there was no association between MMSE and PSD-95 (r=0.08) (E) or GAP-43 (r=0.31)(F) protein levels. (F). Lines at the top of graphs in A, B, and C, indicate Bonferroni corrected post hoc comparisons. Horizontal lines in A,B,C represent group means. Individual data points are shown as open circles. Lines in D, E, and F represent linear regression analyses.

