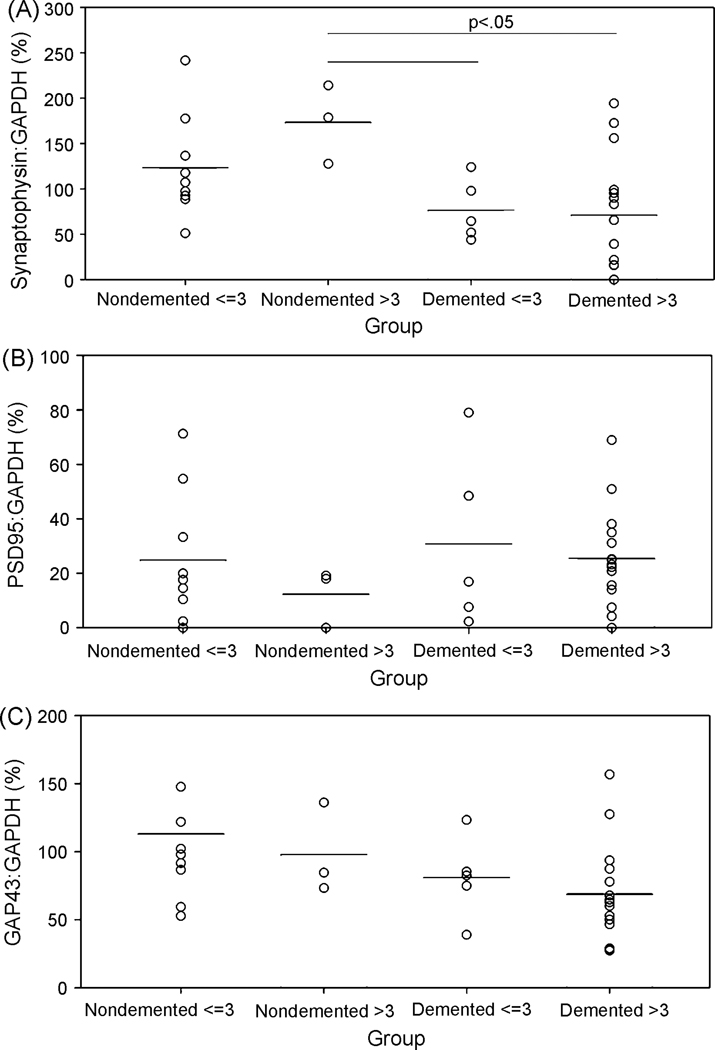
Figure 3.
Comparison of synaptic protein levels between nondemented cases with and without tangle pathology to demented cases with and without tangle pathology. (A) SYN levels were highest overall in nondemented individuals with B&B stage > III. (B) PSD-95, however, was lowest overall only in cases with dementia and a B&B stage > III. (C) In contrast, GAP-43 was lowest overall in demented subjects with a B&B Stage < III. Lines at the top of the graphs indicate significant group differences using Bonferroni post hoc comparisons. Individual data points are represented as open circles and means of each group are shown as horizontal lines.

