
Figure 4.
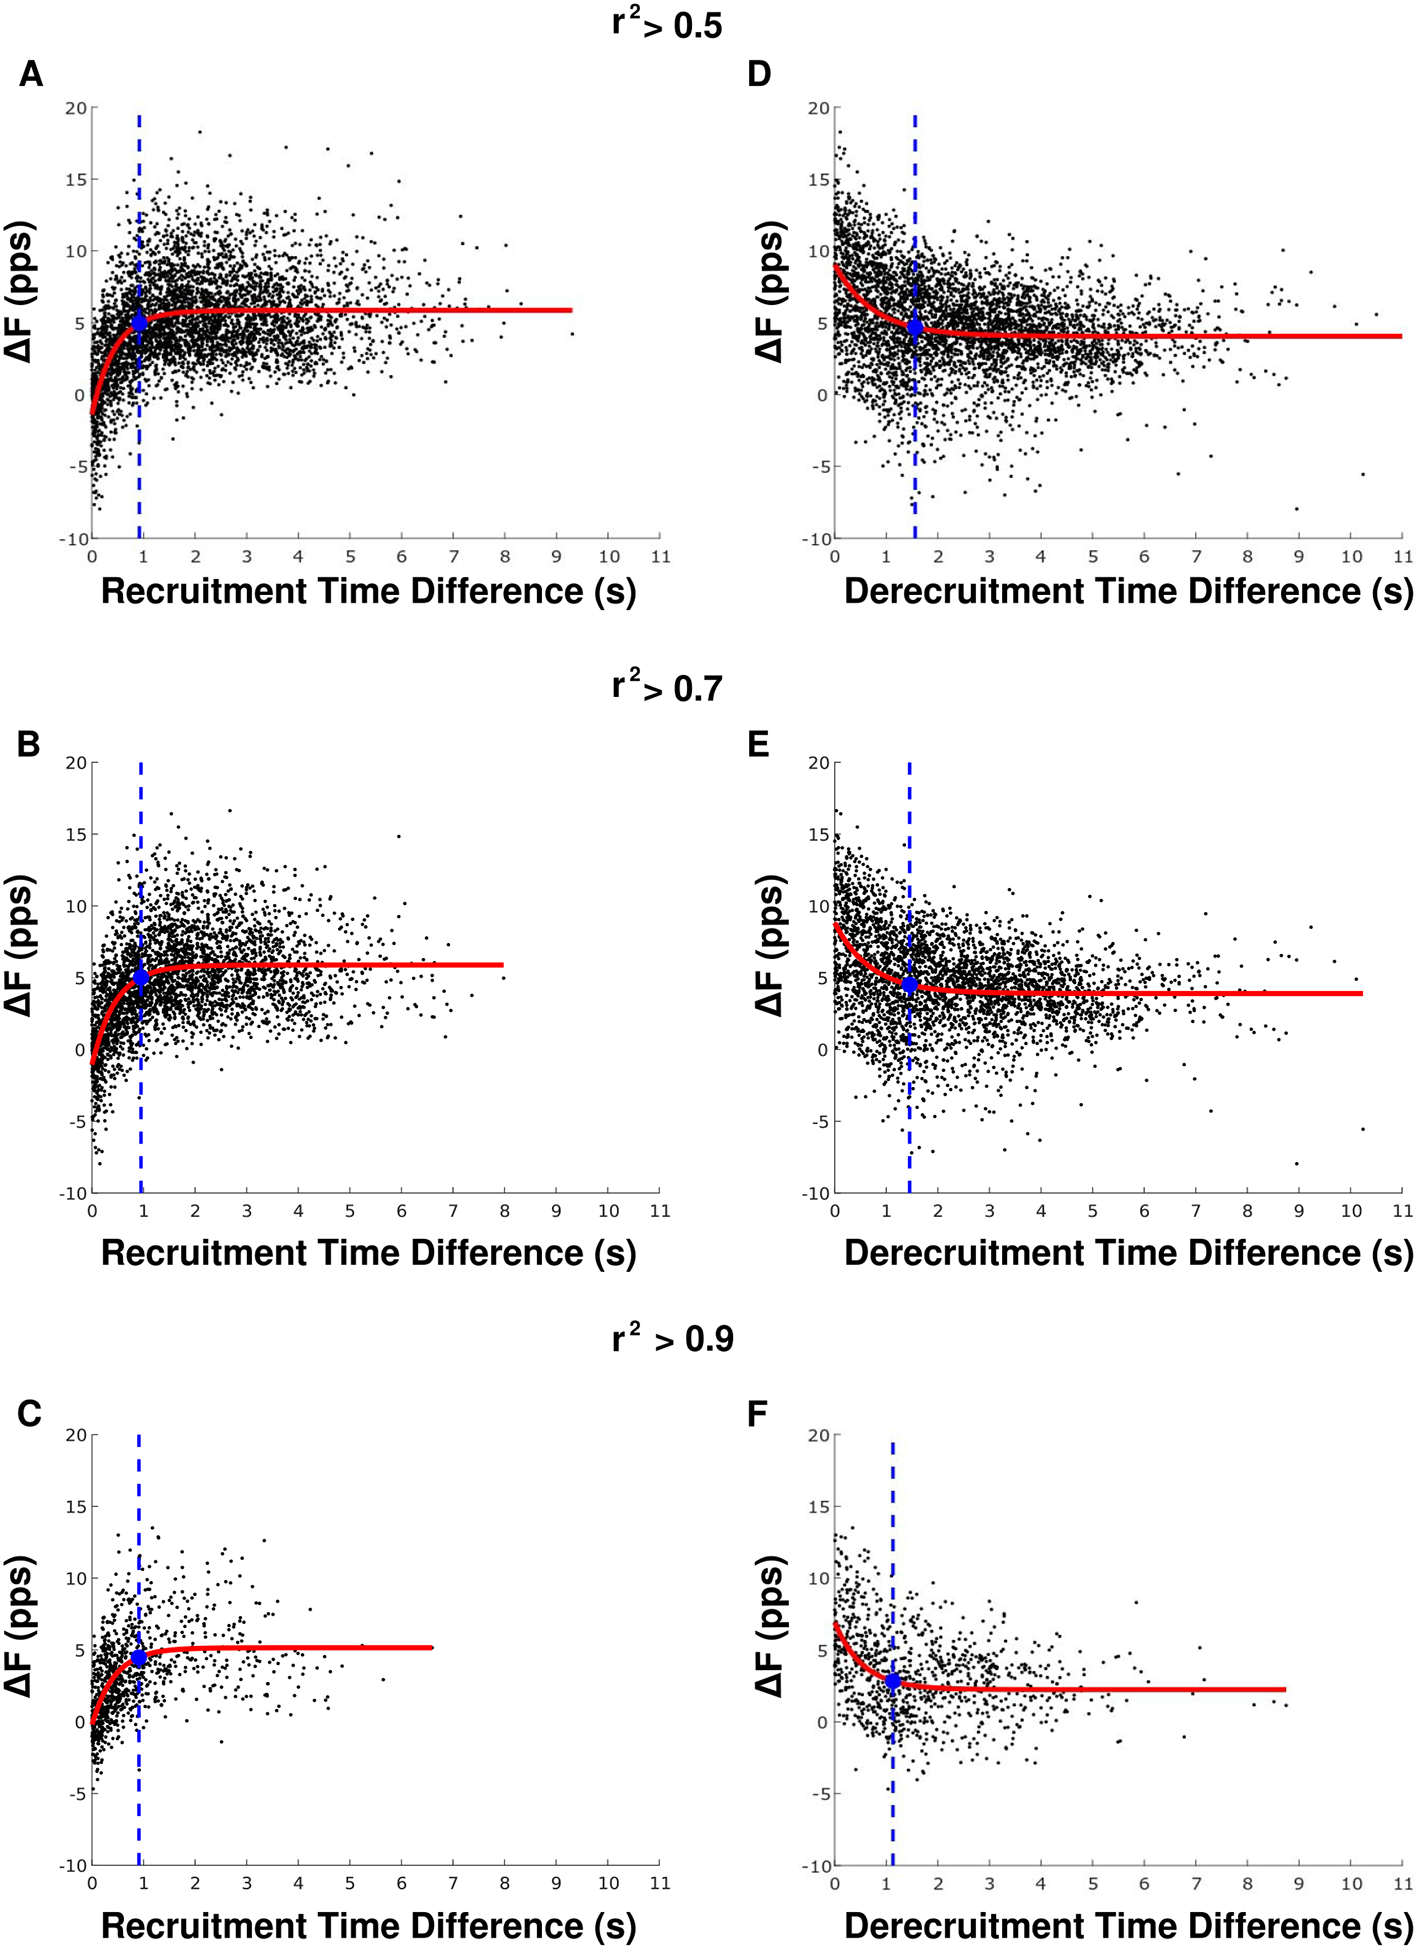
The relationship between recruitment time difference (A)–(C) and ΔF as well as de-recruitment time difference (D)–(F) and ΔF is shown for three different rate-rate correlation thresholds. The red lines denote exponential plateau (A)–(C) or decay (D)–(F) fits. The blue filled circles indicate where the exponential model is 87.5% from the value at t = 0 to the asymptote value. The blue dotted lines indicate the minimum recruitment/de-recruitment time difference used for further analyses.