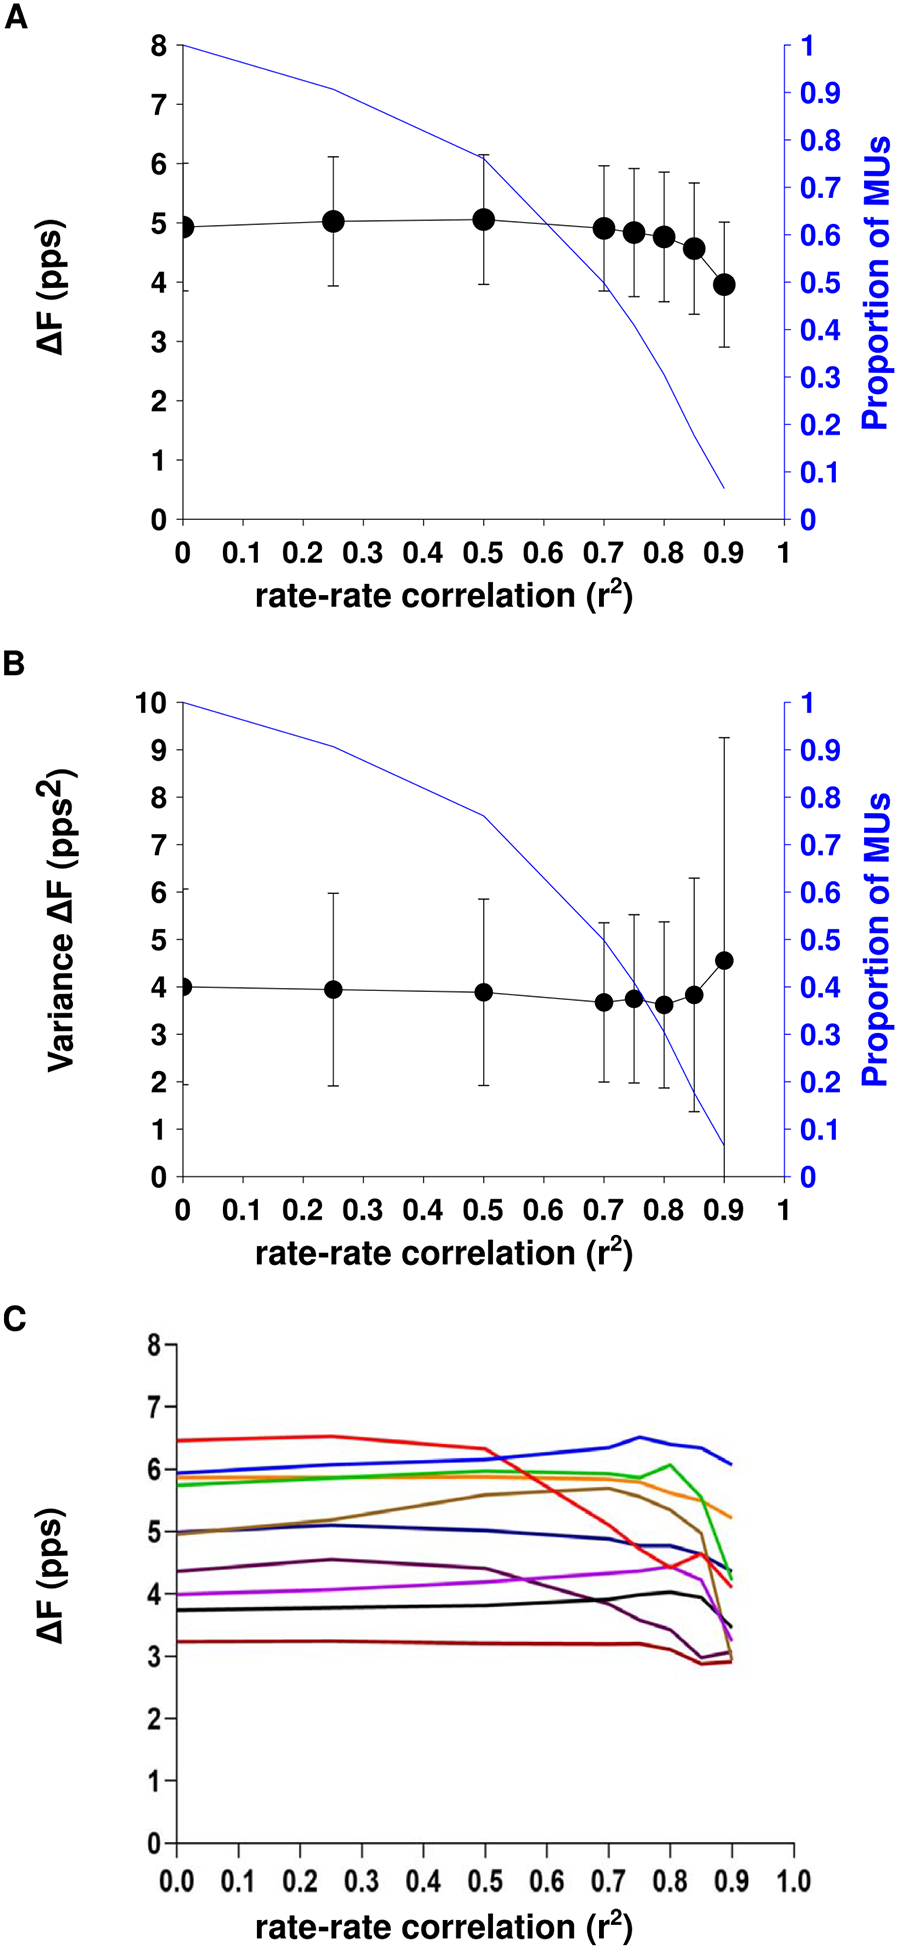
Figure 5.

The group mean ± SD ΔF values (A) and group mean ± SD individual participant variance in ΔF (B) across three different thresholds for rate-rate correlation. The relationship between ΔF and rate-rate correlation threshold for each of the ten participants is shown in part C.
