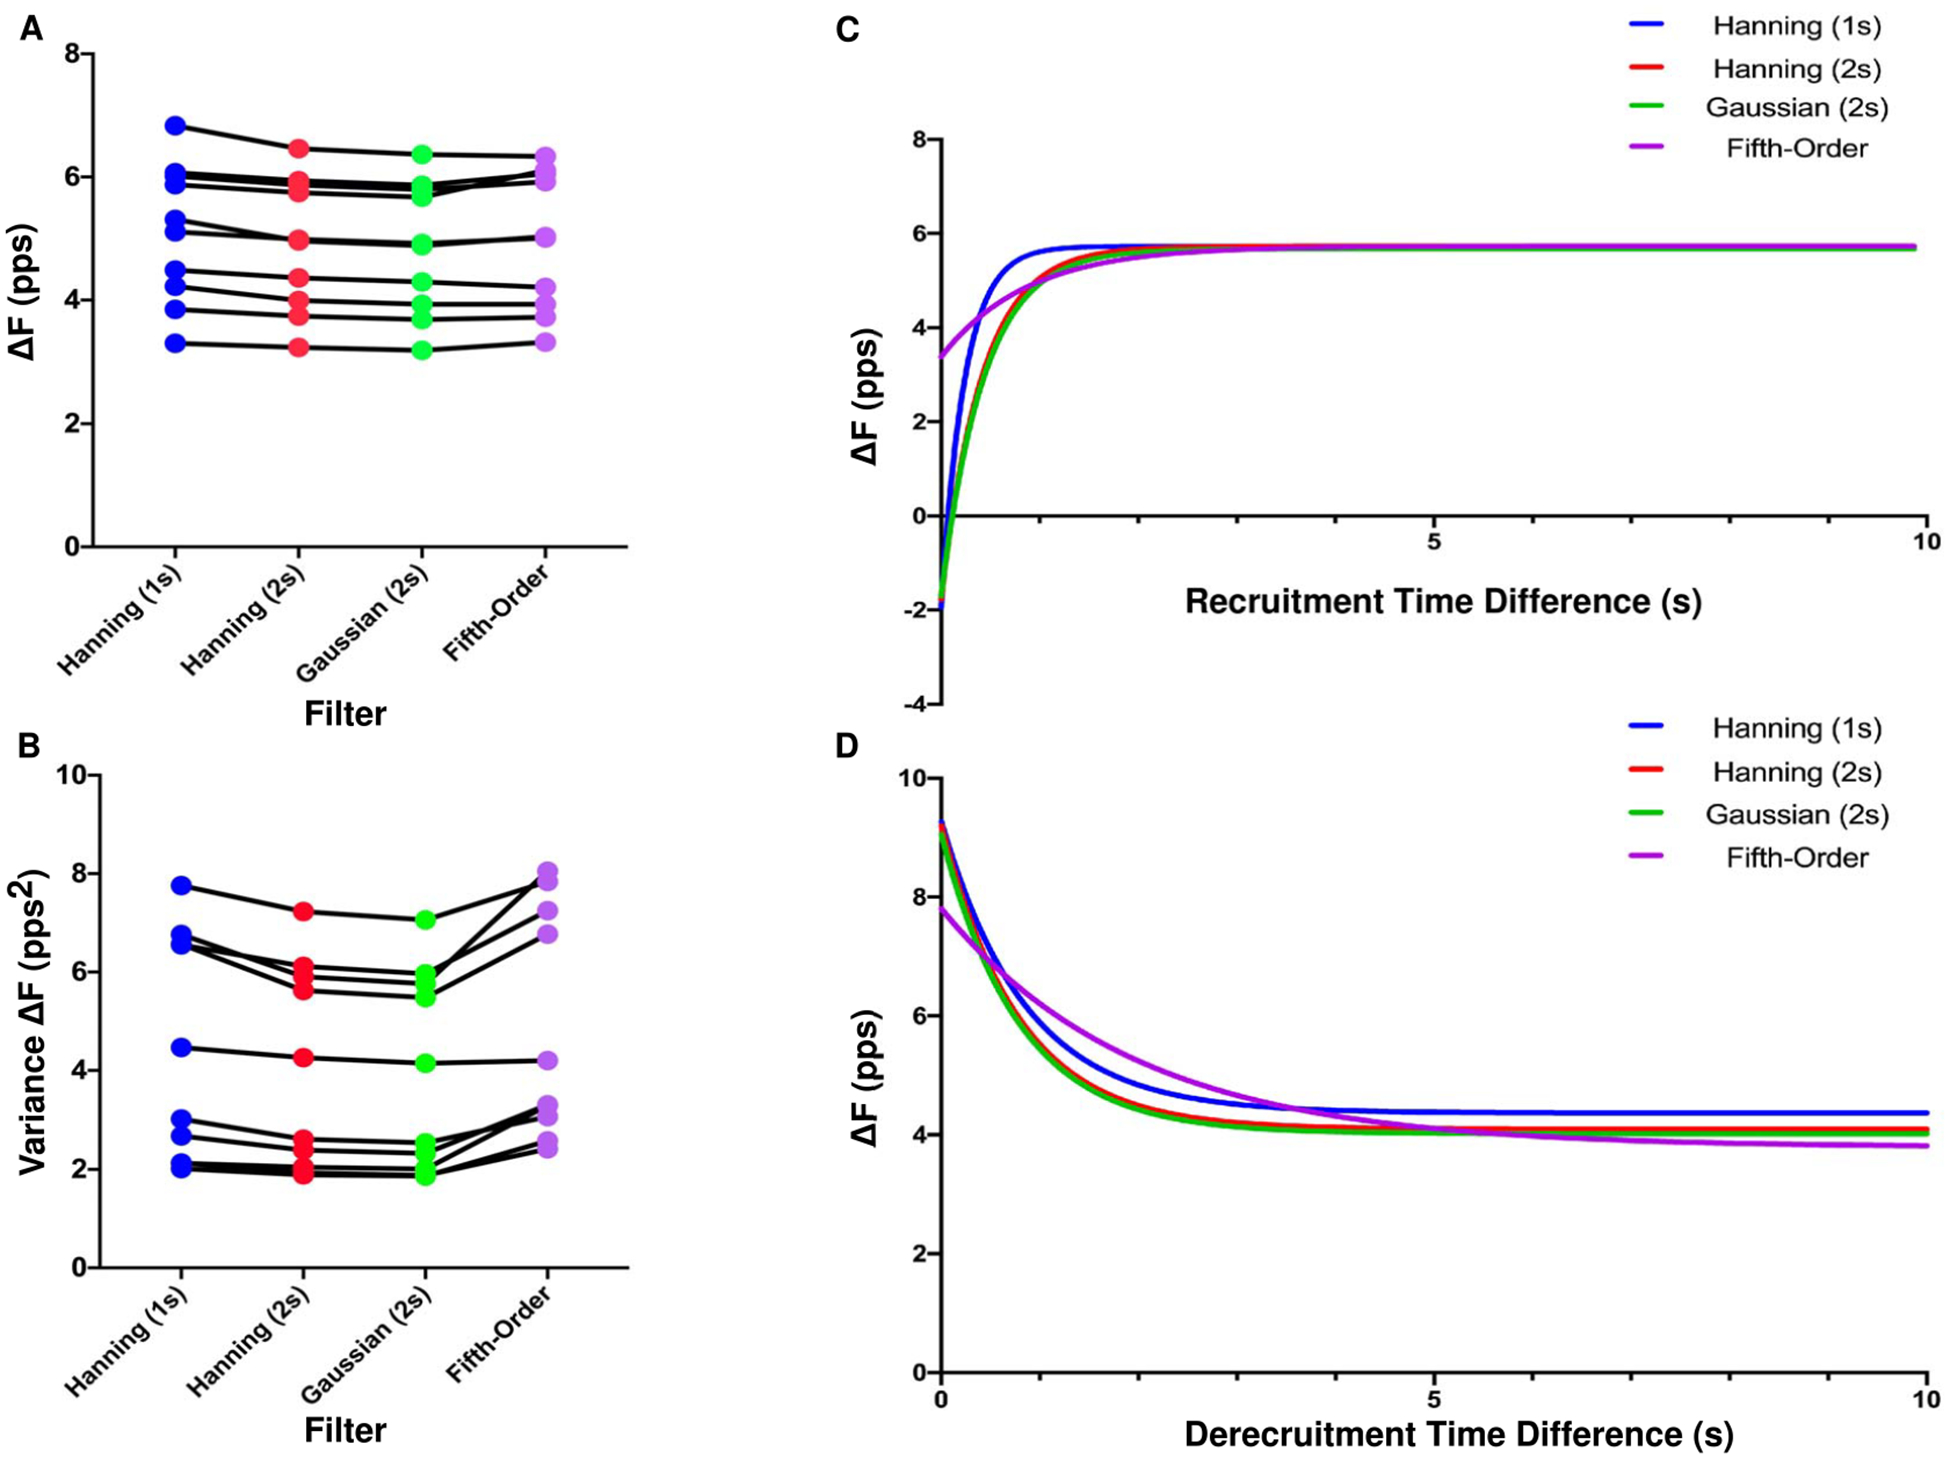
Figure 7.

Mean ΔF (A) and variance in ΔF (B) for each participant plotted across four filter types. An exponential plateau function showing the relationship between ΔF and recruitment time difference (C) and de-recruitment time difference (D) for the same four filter types.
