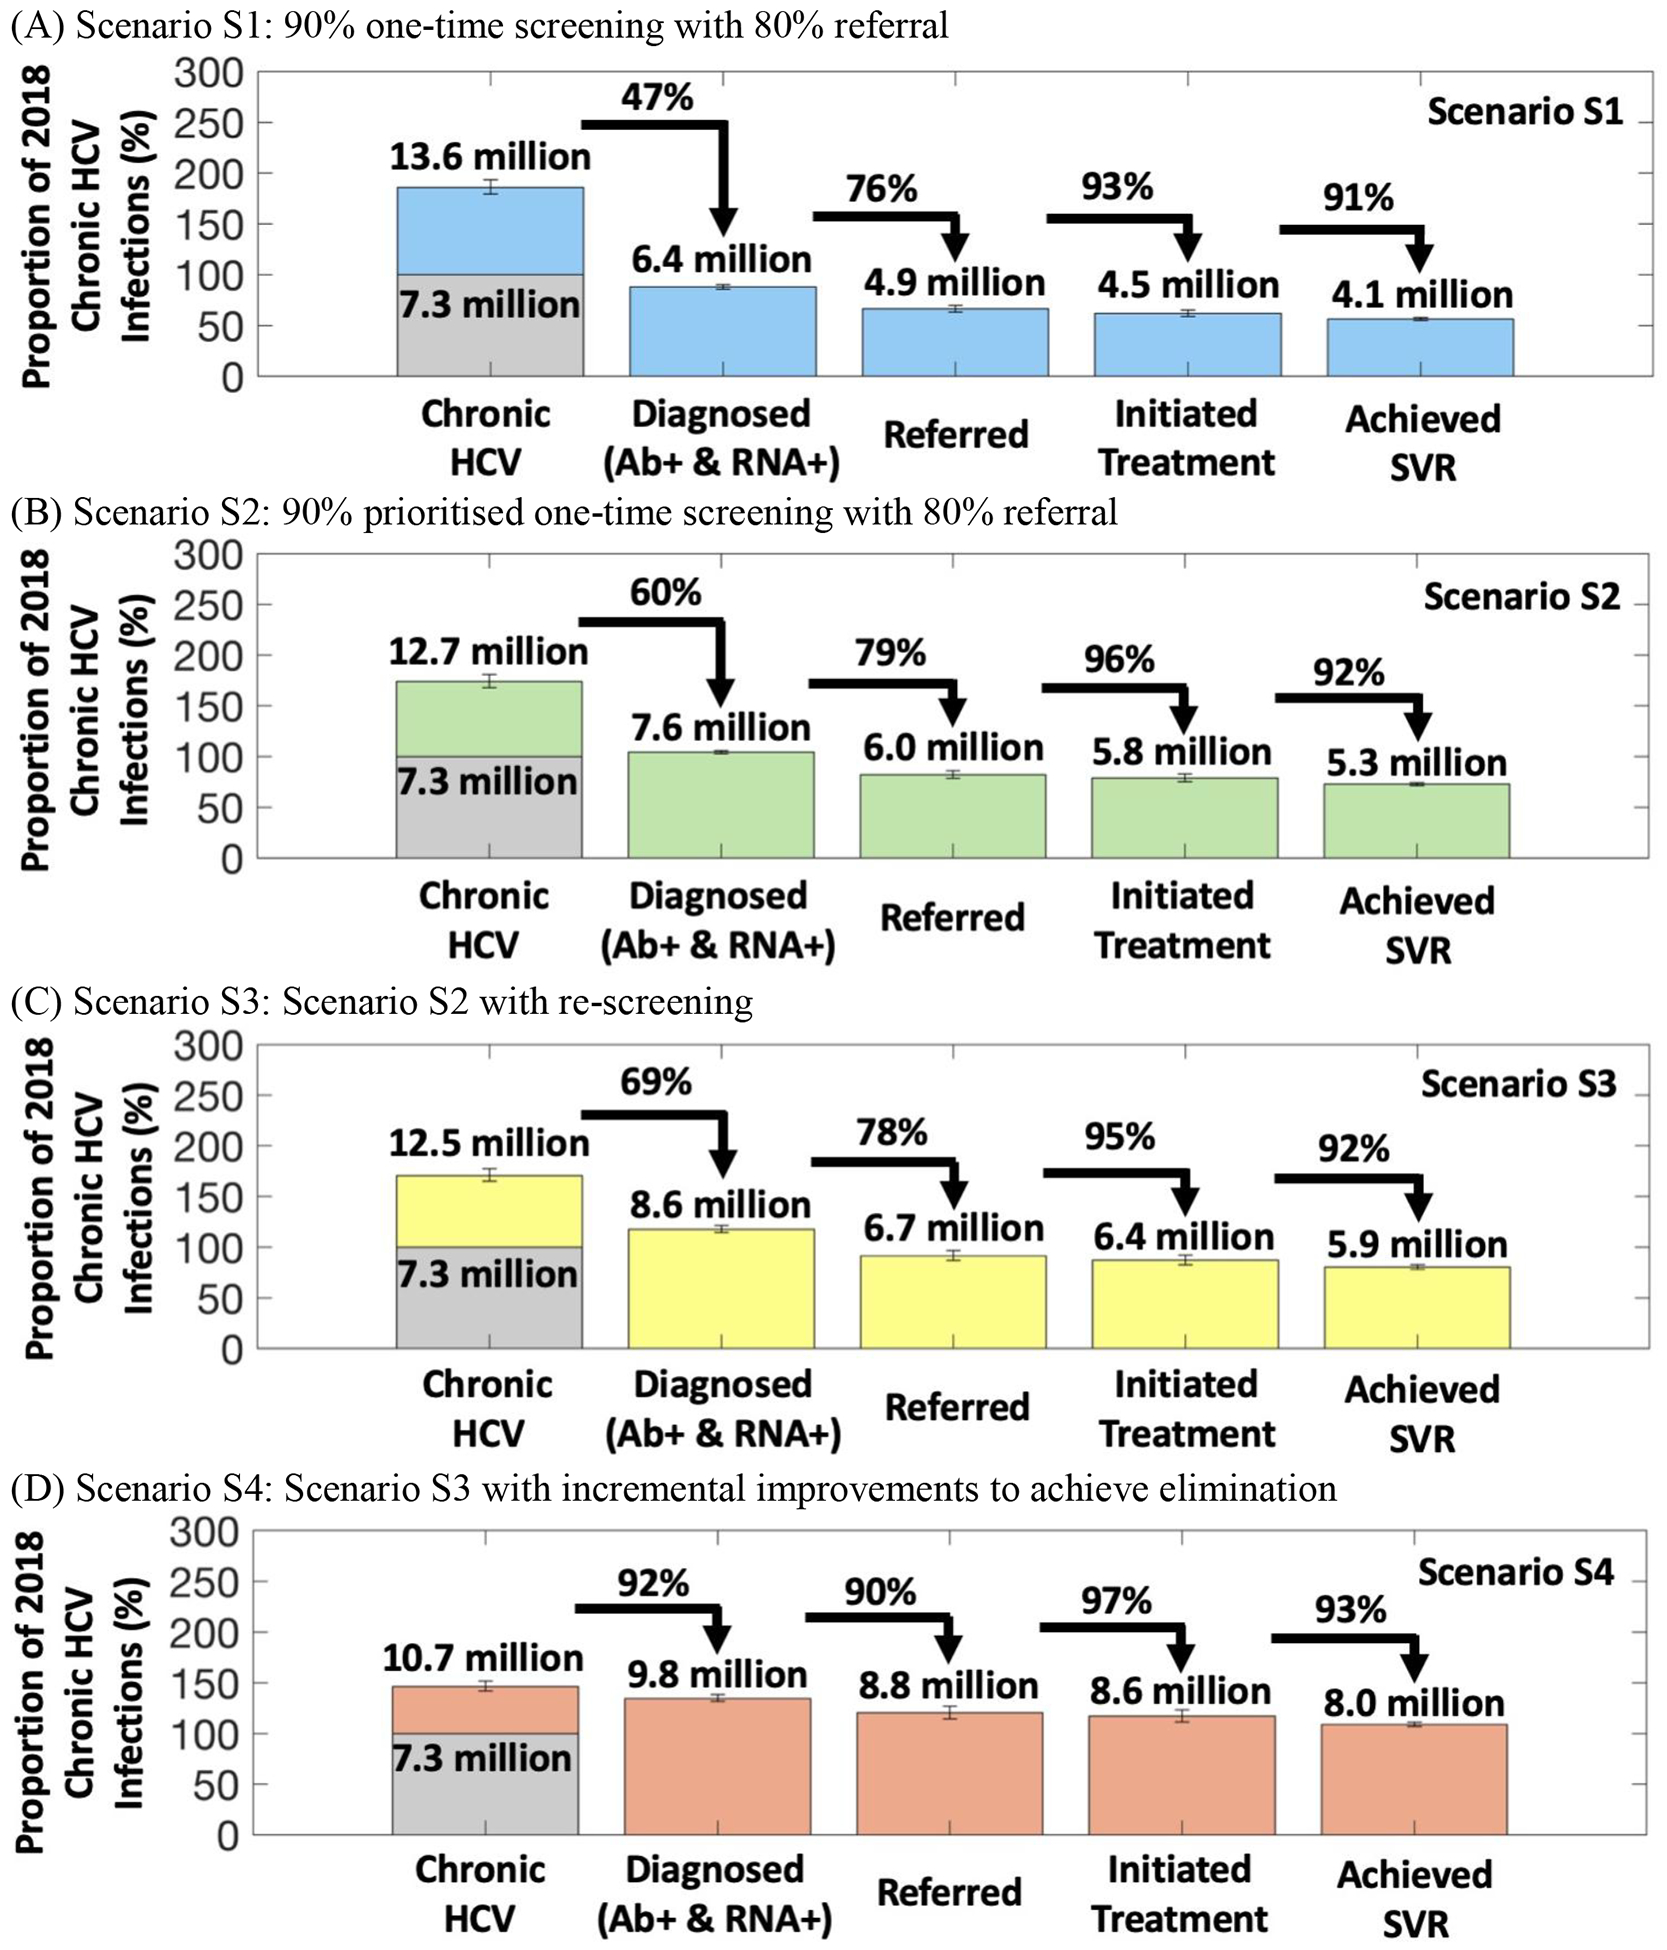
Figure 3.

The cascade of care for Scenarios S1–S4. The heights of each bar show the proportions (numbers above each bar) that are diagnosed, referred, initiated treatment, and achieved SVR relative to the chronic HCV burden in 2018 in the first bar corresponding to 100% (shaded in grey). The full height of the first bar signifies the full burden of HCV infections over 2018–2030 for each scenario which is, specifically, the sum of the chronic HCV burden in 2018 with all new chronic infections that occur from 2018 until 2030 in that scenario. The transitions between each bar indicate the percentage of the previous step in the cascade of care that moves onto the following step. The height of each bar represents the median of 1,151 final model runs, with whiskers indicating 95% uncertainty intervals of runs.
