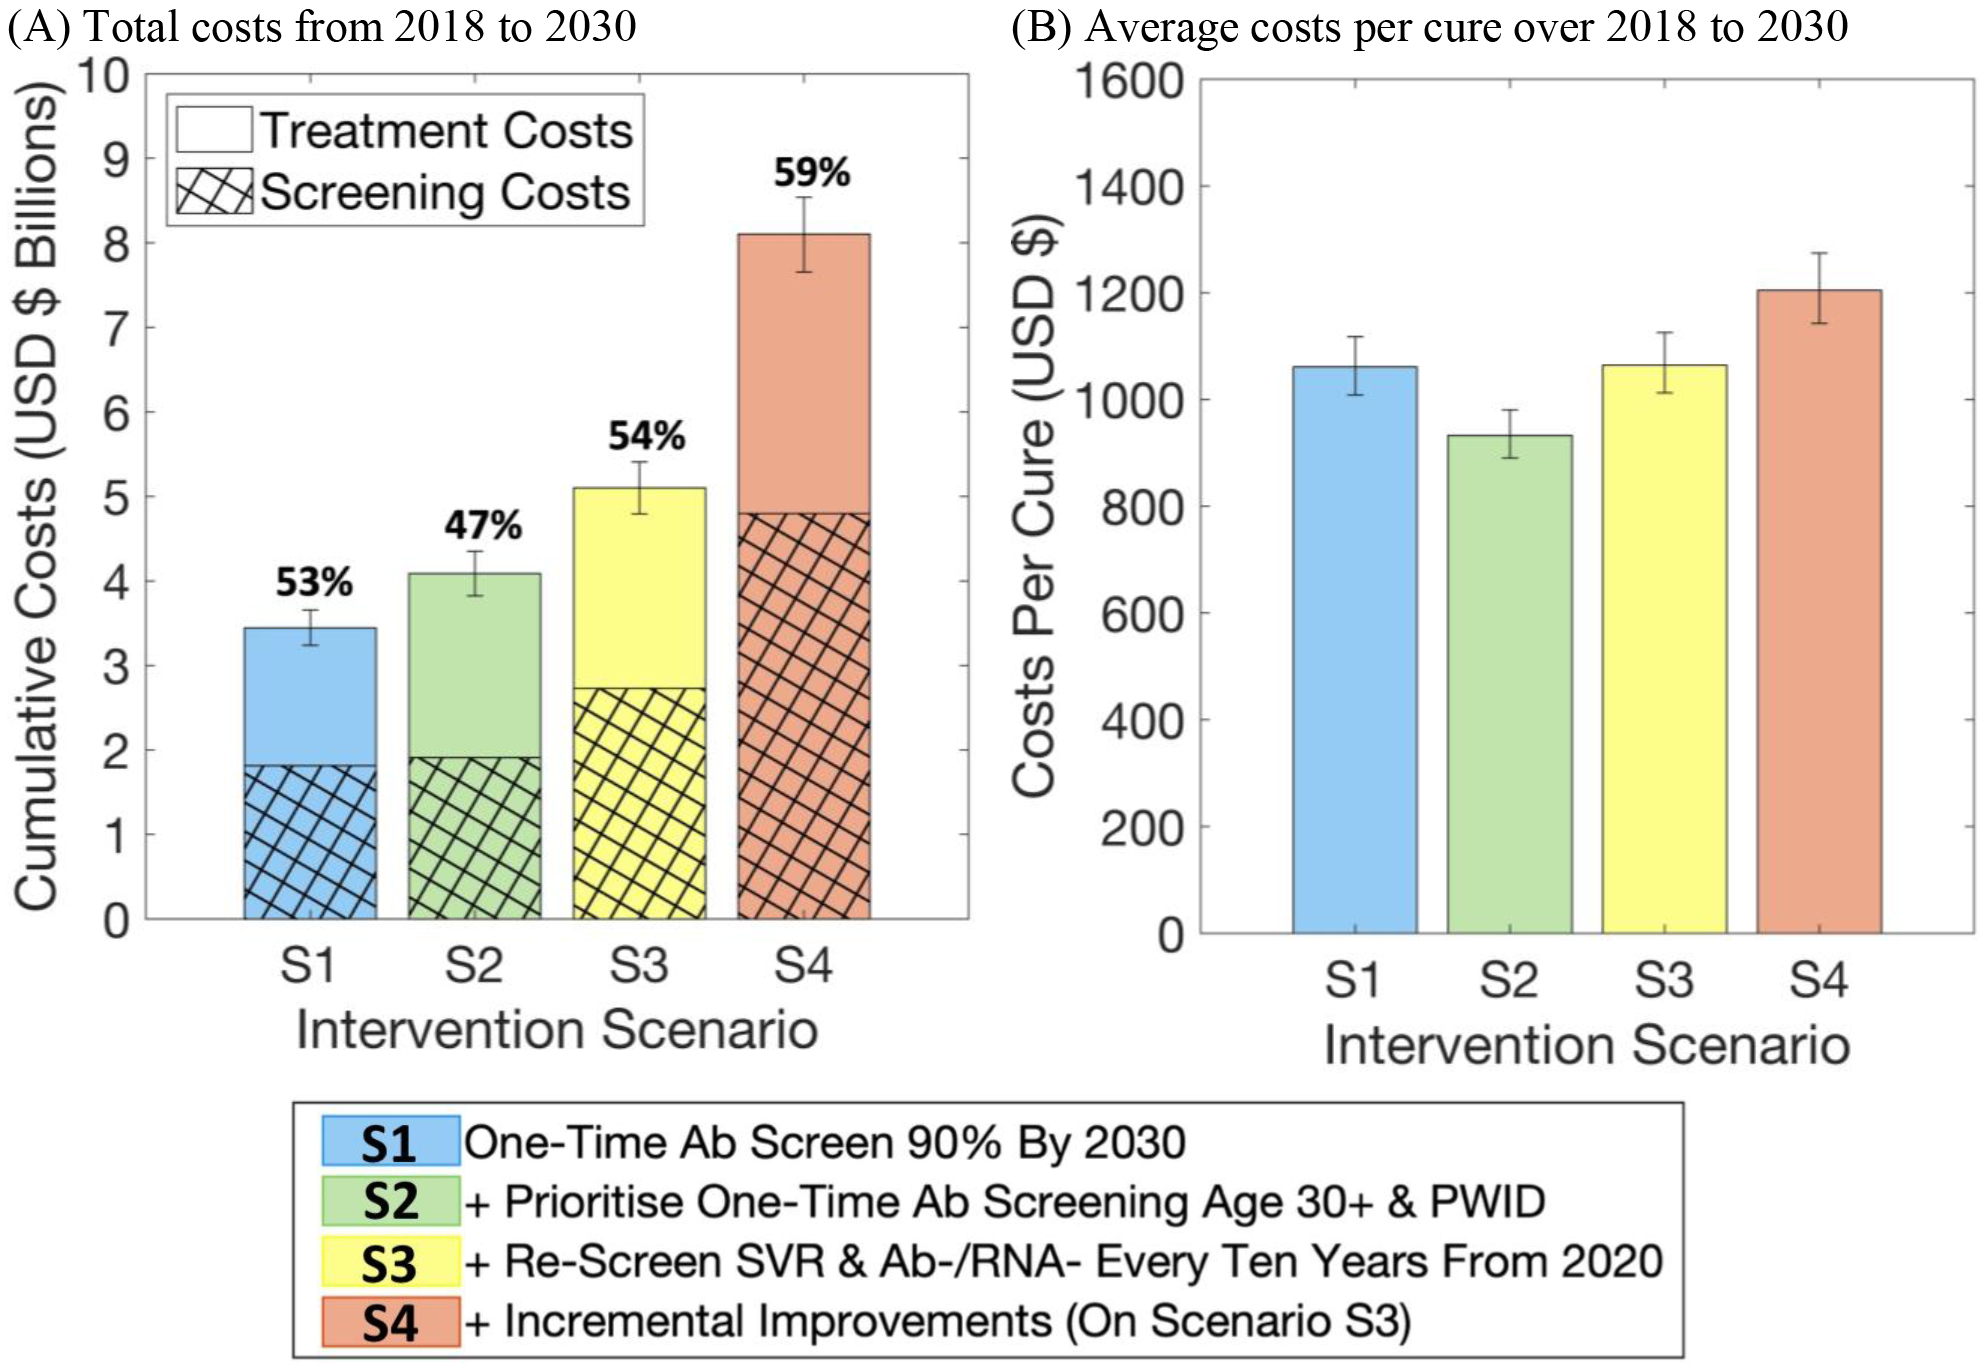
Figure 4.

Estimated (A) total screening and treatment costs, and (B) average costs per cure, for each intervention scenario over 2018–2030. Costs and outcomes are discounted at a standard rate of 3.5% per year. The percentages above each bar in (A) indicate the proportion of total costs that are due to screening.
