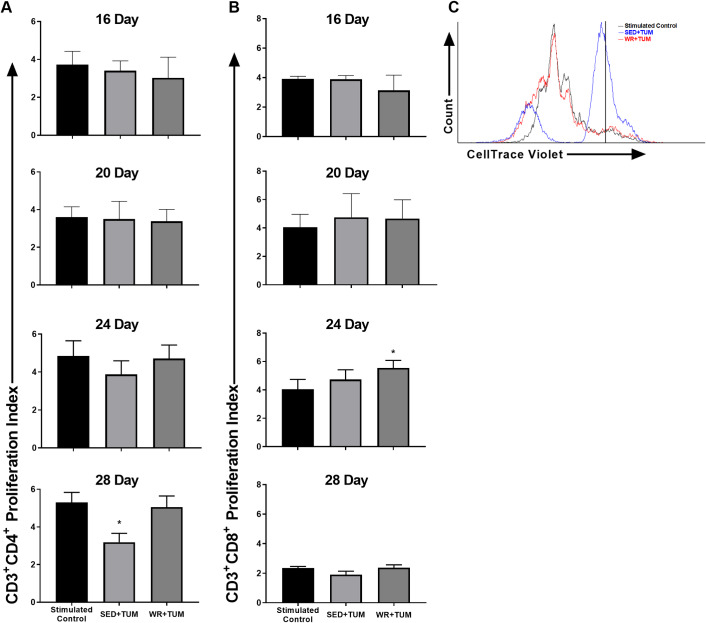
Fig 3. T cell suppression assay in MDSC co-cultures.
(A) CD3+CD4+ T cell proliferation in stimulated controls and IMC/MDSC co-cultures at the specified timepoint post-4T1 cell injection. (B) CD3+CD8+ T cell proliferation in stimulated controls and IMC/MDSC co-cultures at the specified timepoint post-4T1 cell injection. (C) Representative CD3+CD4+ T cell proliferation plot from day 28 samples. All samples were run in duplicate and median CellTrace Violet fluorescence in unstimulated samples was used to set the starting undivided population (vertical black line). Splenocytes were stimulated to proliferate using anti-CD3ε and anti-CD28 antibody. Means ± SEM (n = 8-10/group). *p < 0.05 vs. stimulated control. For statistical analysis a repeated-measures ANOVA with Tukey’s multiple comparison was used.

