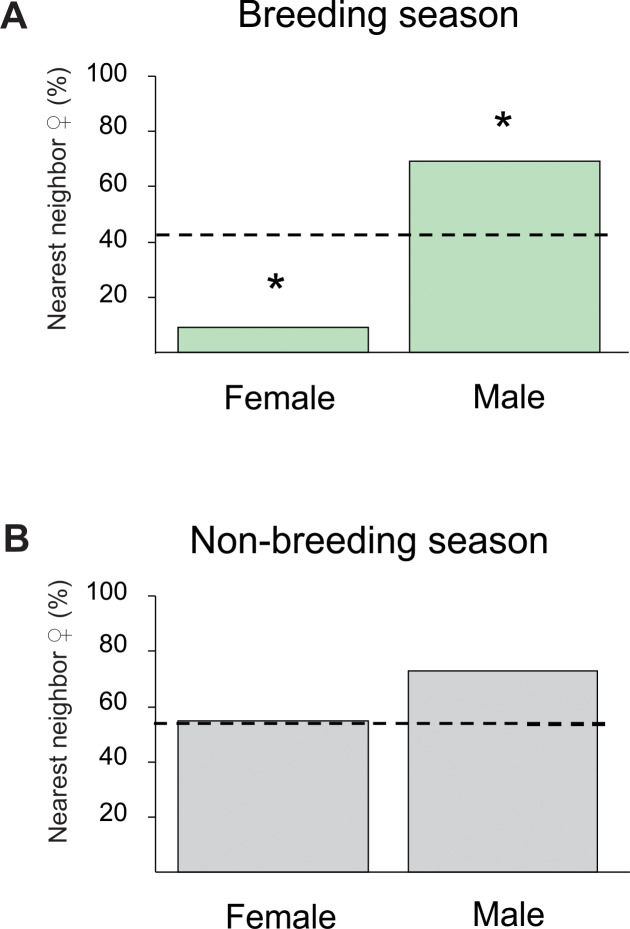
Fig 4. Seasonality in the spatial distribution of sexes (from data obtained in Survey 2).
Sex of the nearest neighbor (expressed in percentage) when the focal fish is a female or a male, both in the breeding season (A, top), and in the non-breeding season (B, bottom). Dashed line represents the expected percentage to have a female as nearest neighbor for a random distribution, according to the empirical sex ratio (41% in the breeding season, and 50.9% in the non-breeding season). * indicates statistical significance (p < 0.05) according to the binomial exact test.

