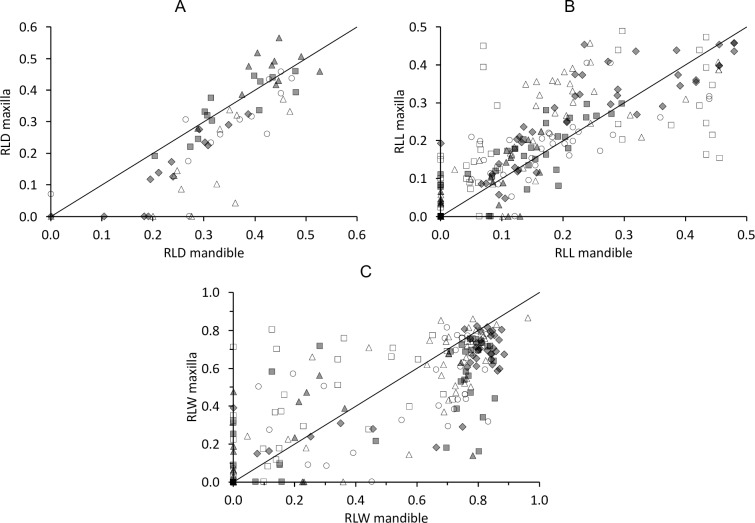
Fig 10. Tapir tooth wear–wear upper vs lower cheek teeth.
Comparisons of the maxillary and mandibular teeth of three tapir species for the quantitative wear measuremens (A) relative loph distance (RLD) for individual teeth, (B) relative loph length (RLL) for individual lophs, (C) relative loph width for individual lophs. White triangle = P3; White circle = P4; Grey diamond = M1; Grey rectangle = M2; Grey triangle = M3. Line represents y = x. Pearson’s correlations: (A) T. terrestris: n = 76, R = 0.77, P<0.001; T. bairdii: n = 32, R = 0.76, P<0.001; T. indicus: n = 12, R = 0.86, P<0.001; (B) T. terrestris: n = 74, R = 0.86, P<0.001; T. bairdii: n = 29, R = 0.89, P<0.001; T. indicus: n = 12, R = 0.90, P<0.001; (C) T. terrestris: n = 70, R = 0.86, P<0.001; T. bairdii: n = 24, R = 0.90, P<0.001; T. indicus: n = 12, R = 0.91, P<0.001. The line denotes y = x.

