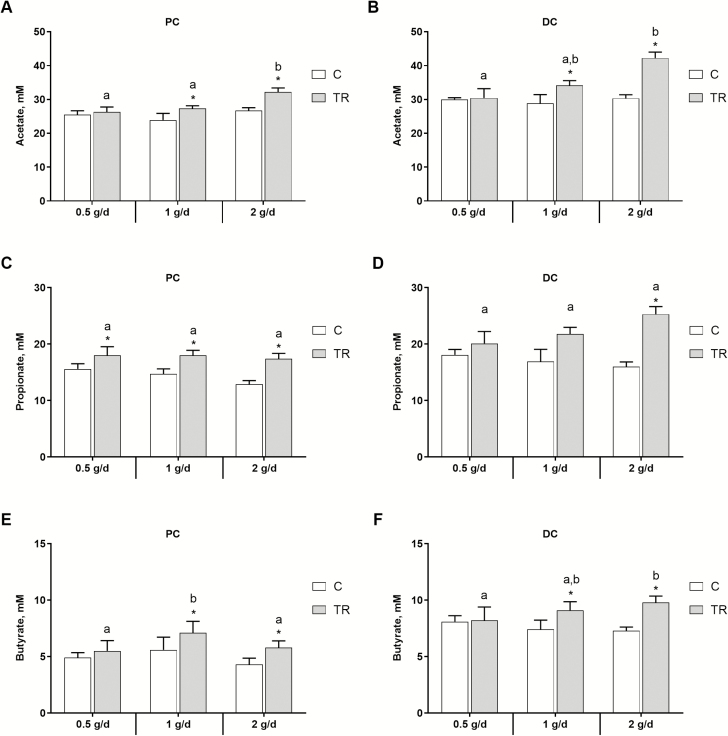
Figure 1.
Microbial metabolic activity in terms of SCFA production. Average acetate (A&B; mM), propionate (C&D; mM), and butyrate (E&F; mM) production over the control (C; n = 6) and the treatment (TR; n = 9) period in the PC (left) and DC (right) of the canine gastrointestinal tract. Data are presented as mean ± stdev. Statistically significant differences relative to the control period are indicated with *, whereas significant differences among the test conditions are indicated with a different letter (P < 0.05).

