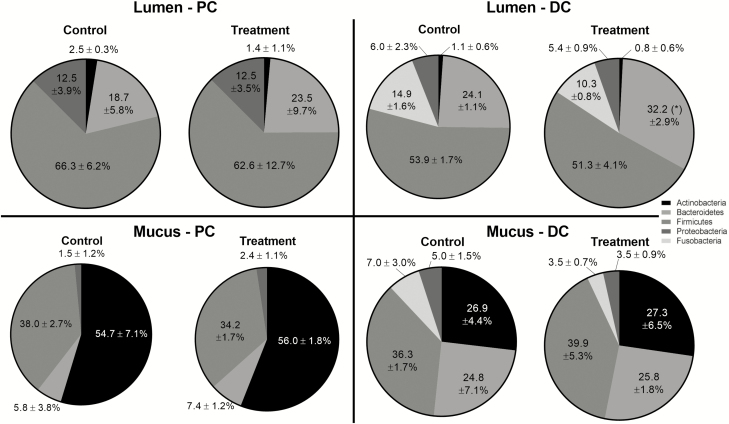
Figure 3.
Microbial community composition as assessed via 16S-targeted Illumina sequencing. Abundance (%) at microbial phylum level in the lumen and mucus of the PC and DC of the canine gastrointestinal tract over the control (C) and the treatment (TR) period. For optimal observation of consistent effects for the different concentrations tested (0.5, 1, and 2 g/d), the average (±stdev) of the three test concentrations is presented (n = 3). Statistically significant differences relative to the control period are indicated with * (P < 0.05).

