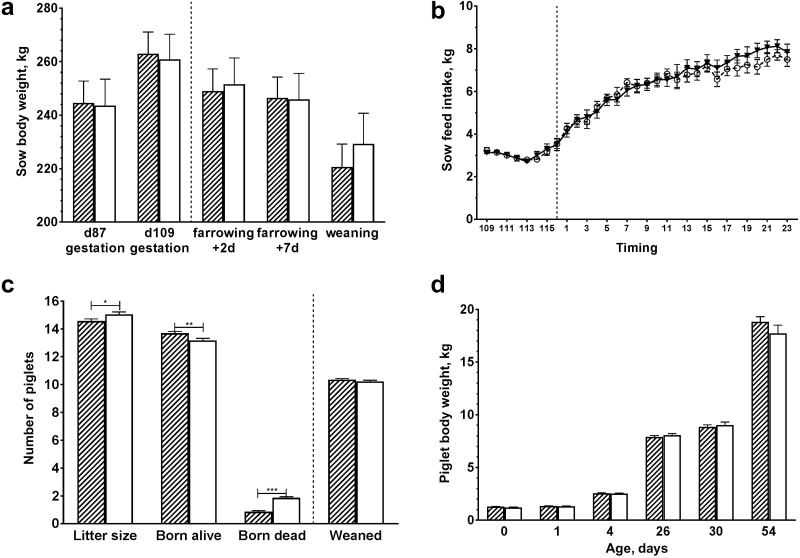
Figure 1.
BW of sows and piglets, feed intake of sows and reproductive traits. BW of sows (panel a); feed intake of sows (panel b); reproduction traits of sows (panel c); BW of piglets are depicted (panel d). Open white bars represent the control group, hatched bars represent the amoxicillin-treated group. The hatched line indicates the moment of farrowing; error bars indicate standard error of the mean; * P < 0.05; ** P < 0.01; *** P < 0.001.

