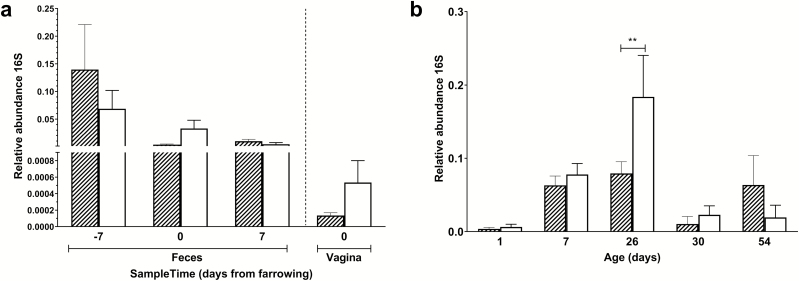
Figure 2.
Abundance of microbiota as determined using a quantitative PCR on 16S rDNA genes. qPCR was performed on fecal and vaginal samples from sows (panel a) and jejunal content of piglets (panel b). Quantities were expressed relative to an internal PCR control (GFP) to correct for putative inhibition in individual samples. Open white bars represent the control group, hatched bars represent the amoxicillin-treated group; error bars indicate standard error of the mean; ** P < 0.01.

