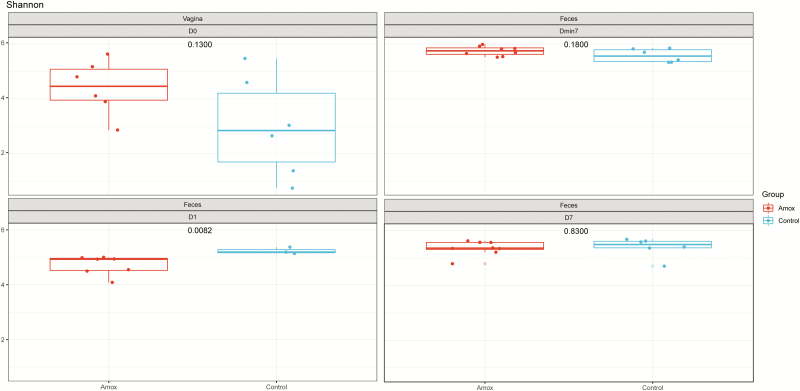
Figure 3.
Shannon diversity of vagina and fecal samples of amoxicillin and control sows. Left top panel depicts the sow vagina microbiota diversity for amoxicillin (red) and control (blue). Whereas the right top panel depicts the sow fecal microbiota diversity at day −7, i.e., 7 d before starting the antibiotic treatment. Left bottom panel shows day 1, i.e., 1 d after cessation of the antibiotic treatment, and the right bottom panel shows 7 d after cessation of the antibiotic treatment. The numbers in the center of each panel represent the P-value as calculated by a Student’s T-test comparing the Amox vs. the control group.

