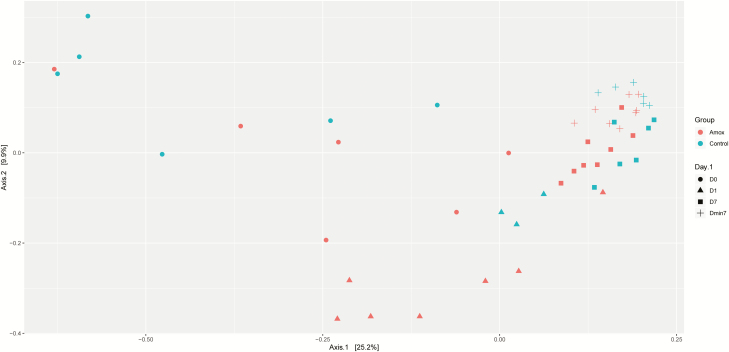
Figure 4.
Principal coordinate analysis of the vagina and fecal samples of amoxicillin and control sows. Groups are depicted by different colors, where red represents amoxicillin-treated sows and blue represents control sows. The site of sampling and day are depicted by shape, filled circle, for vagina day 0 (V_D0), + for feces day −7 (7 d before starting the antibiotic treatment, F_Dmin7), filled triangle, for feces day 1 (1 d after cessation of the antibiotic treatment, F_D1), and filled square, for day 7 (7 d after cessation of the antibiotic treatment, F_D7). The first axis explains 25.2% of the variation, whereas the second axis explains 9.9%.

