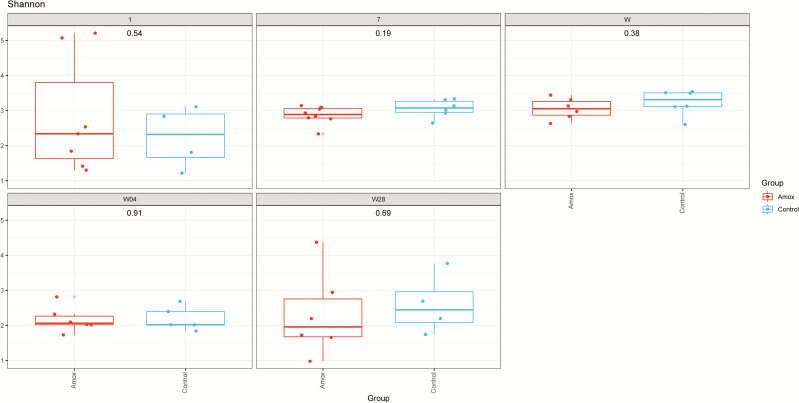
Figure 5.
Shannon diversity of jejunal samples of amoxicillin and control piglets. Each panel represents a different day, from top left to bottom right, days 1, 7, weaning, 4 d postweaning, and 28 d postweaning. Red depicts offspring from amoxicillin-treated sows and blue depicts offspring from control sows, the value in the center represents the P-values.

