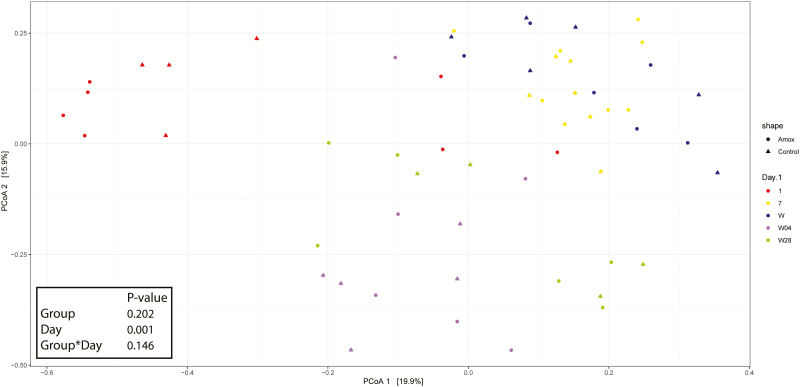
Figure 6.
Principal coordinate analysis of jejunal microbiota composition of offspring from amoxicillin-treated sows or control sows. Each dot represents data from one animal. Colors indicate the age the piglets belong to; red, day 1 piglet jejunum; yellow, day 7 piglet jejunum; dark blue, day W piglet jejunum; lilac, day W28 piglet jejunum; and light green, day W4 piglet jejunum. Whereas the shape corresponds to the treatment group, control (triangle) and amoxicillin (circle) piglets. In the bottom left, the P-values for Group, Day, and Group × Day are depicted resulting from the “Permutational Multivariate Analysis of Variance Using Distance Matrices.”

