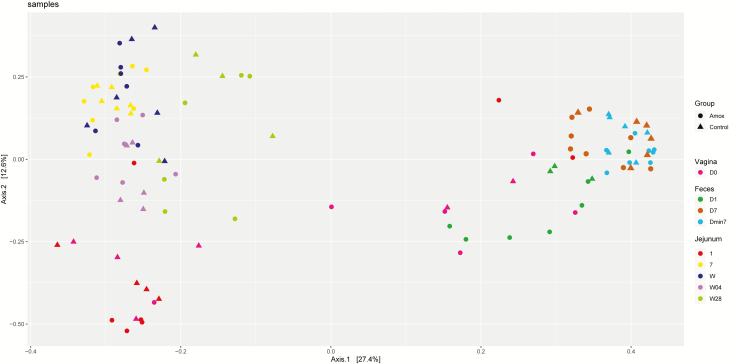
Figure 8.
Principal coordinate analysis of all microbiota samples based on Bray–Curtis dissimilarities. Each dot represents one animal. Groups are depicted by different symbols, where circles represent amoxicillin-treated sows and triangles represent control sows. Color depicts the sampling site and day: magenta, day 0 (birth offspring) sow vagina red; dark green, day 1 after cessation amoxicillin treatment sow feces; brown, day 7 after cessation amoxicillin treatment sow feces; light blue, 7 d before start amoxicillin treatment sow feces; red, day 1 piglet jejunum; yellow, day 7 piglet jejunum; dark blue, day W piglet jejunum; lilac, day W28 piglet jejunum; and light green, day W4 piglet jejunum.

