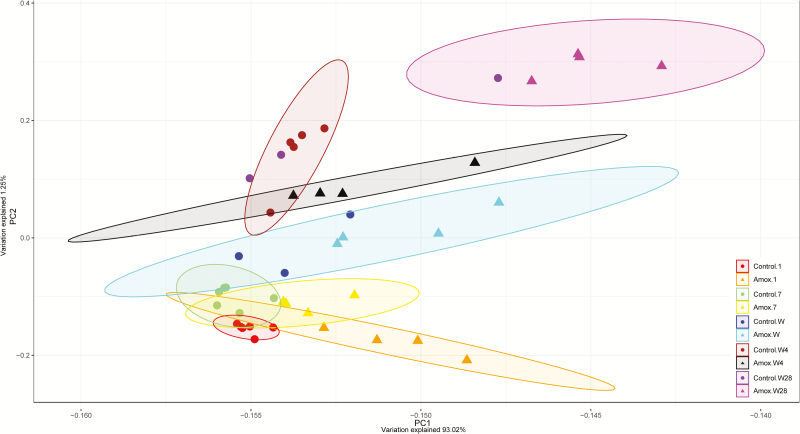
Figure 9.
Principal component analysis of jejunal gene expression of offspring from sows that either received amoxicillin treatment or belonged to the control group. The variation explained on PC1 is 93.02% and for PC2 1.25%. Each dot represents data from 1 animal, triangles represent piglets from amoxicillin-treated sows; circles represent piglets from control sows. Colors indicate the age and group the piglets belong to; orange is day 1 amoxicillin (amox), red is day 1 control, yellow is day 7 amox, green is day 7 control, cyan is day weaning (W; d26) amox, blue is W control, black is 4 d postweaning (W4) amox, brown is W4 control, magenta is day 28 postweaning (W28) amox, purple is W28 control. Note that no ellipses could be drawn for control W (d26) and control W28, because only three piglets remained after quality control.

