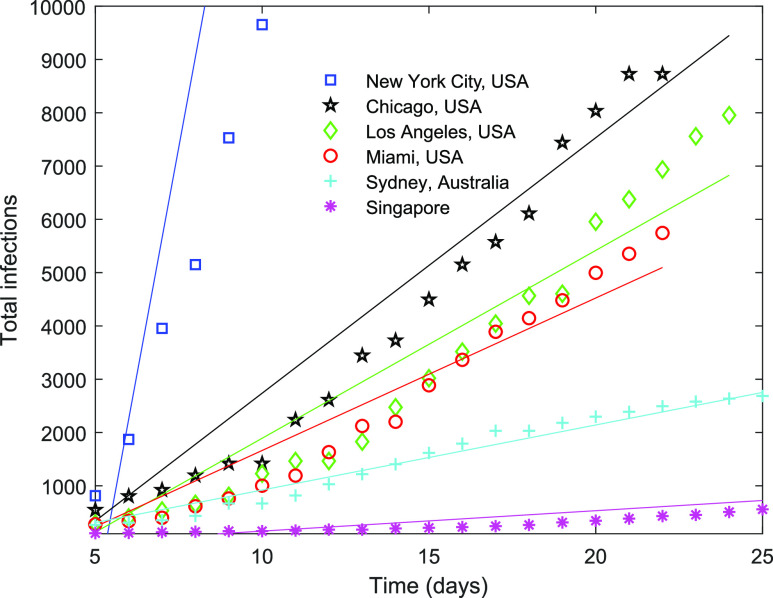
FIG. 5.
Comparison among evolution of the total infections in different cities/regions. Day 0 is defined as the day on which the total number of infections is 100 or larger. The slope of the linear fit obtained using the least-squares method is considered as the growth rate of the infection (the number of infections per day).

