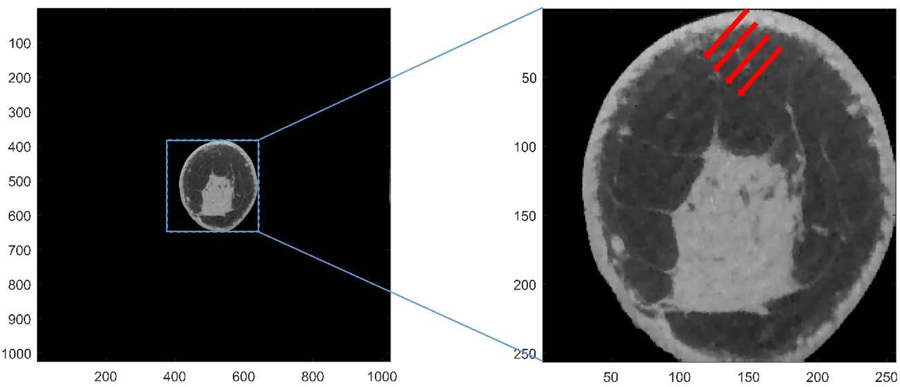
Figure 1.

An example of breast CT image reconstructed using ASD-POCS algorithm implemented in the TIGRE toolbox. Left: original image array of the entire field of view. Right: image array with zoom in. Interference-like artifacts (indicated by red arrows) can be clearly observed. The display range is [0.20 0.40] cm−1.
