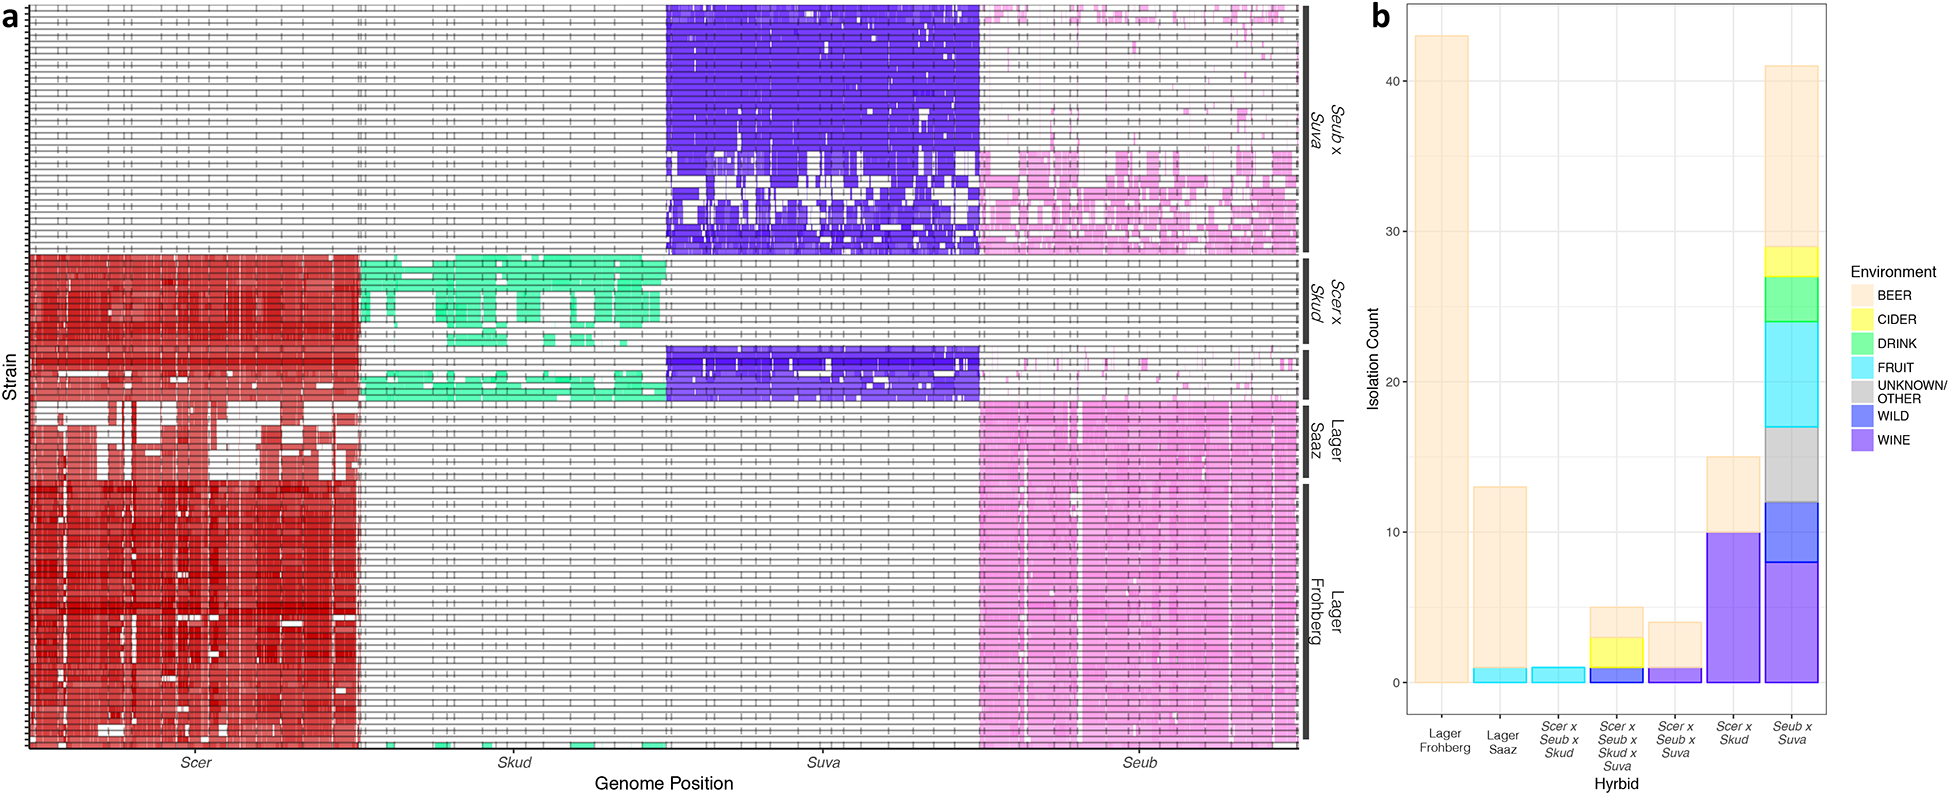
Figure 1. Summary of genomic contributions and isolation environments for interspecies hybrids.

(a) Hybrids were clustered by genomic contributions. Lager strains are in the bottom half, S. uvarum × S. eubayanus strains are at the top, and most complex hybrids are in the middle, except for the single S. cerevisiae × S. eubayanus × S. kudriavzevii hybrid (very bottom). Individual hybrid strains are along the y-axis, and the genomes of the species contributing to hybrids are along the x-axis. S. cerevisiae (Scer) is in red, S. kudriavzevii (Skud) is in green, S. uvarum (Suva) is in purple, and S. eubayanus (Seub) is in pink. Dotted lines indicate chromosomes. Ploidy estimates are indicated by opacity, where darker regions are higher ploidy. (b) Counts of hybrids isolated from different environments. The lagers have been split into Saaz and Frohberg lineages. Other is grouped with Unknown and represents one isolate from a distillery. Tables S1 & S3 includes all isolation information and metadata.
