Figure 1.
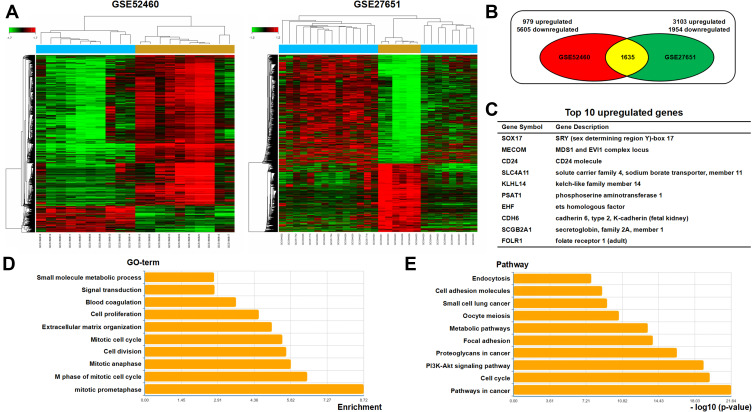
Overexpression of PSAT1 in EOC tissues. Two microdissected profiling datasets (GSE52460, GSE27651) were used for transcriptomic analysis. Both datasets included serous ovarian carcinoma and normal ovarian tissues. (A) Clustering of differentially expressed genes in EOC datasets. Fold Change > 2, P < 0.05. (B) Venn diagram of analysis results using the microdissected profiling datasets of EOC tissues. (C) Top 10 upregulated differentially expressed genes most associated with EOC tumorigenesis. (D) TOP 10 enriched GO terms in differentially expressed genes. (E) TOP 10 enriched pathways in differentially expressed genes.

