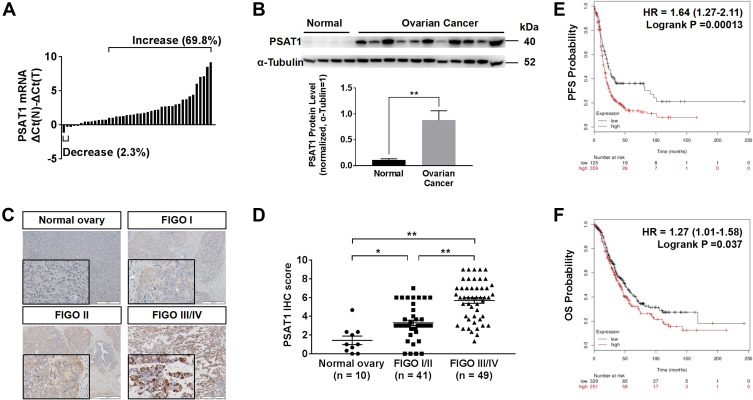
Figure 3.
Up-regulation of PSAT1 in EOC correlated with poor prognosis. (A) Relative PSAT1 mRNA levels in 43 EOC tissues and 6 normal ovarian tissues. Bar value ≤ –1 indicates that PSAT1 was reduced; ≥ 1 indicates that PSAT1 was elevated in tumors. (B) Western blot analysis of PSAT1 in 11 EOC tissues and 4 normal ovarian tissues. α-Tubulin was used as the loading control. T-test, **P < 0.01. Error bars in panels are defined as SEM. (C) Representative immunohistochemistry (IHC) images of PSAT1 expression in ovarian cancer tissues of different stages. Scale bar, 200 μm. (D) Scatter plots of IHC scores from FIGO stage I/II to III/IV of EOC specimens. ANOVA with post hoc tests, **P < 0.01, *P < 0.05. (E, F) Kaplan–Meier analysis of progression-free survival (PFS) and overall survival (OS) of EOC patients categorized by PSAT1 expression determined by mRNA gene chip.

