Figure 4.
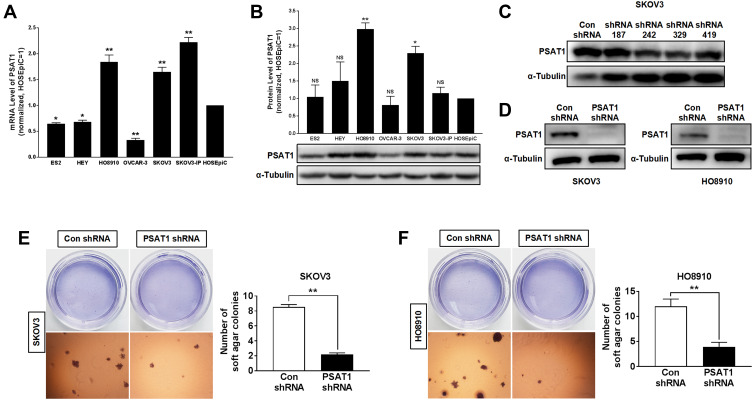
Knockdown of PSAT1 inhibited tumorigenicity of EOC cells in vitro. (A) PSAT1 mRNA levels in ES2, HEY, HO8910, OVCAR-3, SKOV3, SKOV3-IP, and normal ovarian epithelial cell line HOSEpiC (n = 3). **P < 0.01, *P < 0.05 vs HOSEpiC, ANOVA with post hoc tests. (B) Western blot analysis of PSAT1 and α-Tubulin in ovarian cancer cell lines (lower); the normalization expression of PSAT1 (upper) (n = 3). α-Tubulin was used as a control. **P < 0.01, *P < 0.05 vs. HOSEpiC, ANOVA with post hoc tests. (C) Western blot analysis of PSAT1 and α-Tubulin for SKOV3 cells transfected with nonspecific shRNA (Con shRNA) or PSAT1-specific shRNA (shRNA 187, shRNA 242, shRNA 329, and shRNA 419). (D) Western blot analysis of PSAT1 and α-Tubulin for SKOV3 and HO8910 cells transfected with lentivirus-mediated shRNA 329 interference vectors (PSAT1 shRNA). (E) Histograms represent the quantification of colony formation of SKOV3 with or without stable PSAT1 knockdown in soft agar under low magnification. Scale bar = 500 μm (n = 3). T-test, **P < 0.01. (F) Histograms represent the quantification of colony formation of SKOV3 with or without stable PSAT1 knockdown in soft agar under low magnification. Scale bar = 500 μm (n = 3). T-test, **P < 0.01. All error bars in panels are defined as SEM.
Abbreviation: NS, not significant.

